Unlock a world of possibilities! Login now and discover the exclusive benefits awaiting you.
Announcements
ALERT: QlikView server communication interruptions following Microsoft Windows Domain Controller security updates
- Qlik Community
- :
- All Forums
- :
- QlikView
- :
- Histogram chart Ppk
Options
- Subscribe to RSS Feed
- Mark Topic as New
- Mark Topic as Read
- Float this Topic for Current User
- Bookmark
- Subscribe
- Mute
- Printer Friendly Page
Turn on suggestions
Auto-suggest helps you quickly narrow down your search results by suggesting possible matches as you type.
Showing results for
Not applicable
2014-01-10
04:38 AM
- Mark as New
- Bookmark
- Subscribe
- Mute
- Subscribe to RSS Feed
- Permalink
- Report Inappropriate Content
Histogram chart Ppk
Hi all,
Can anyone let me know how to create an histogram chart of Ppk (Process Performance). The attached Histogram screenshot is developed by SAS tool.
Can any one let me know how to create same chart in qlikview ?
Please suggest your ideas on this, that really helps me to trace the solution.
Thanks in advance.
Regards,
Venkat
725 Views
2 Replies
Partner - Specialist
2014-01-10
05:11 AM
- Mark as New
- Bookmark
- Subscribe
- Mute
- Subscribe to RSS Feed
- Permalink
- Report Inappropriate Content
Hi,
you have to create a chart, then add trendlines
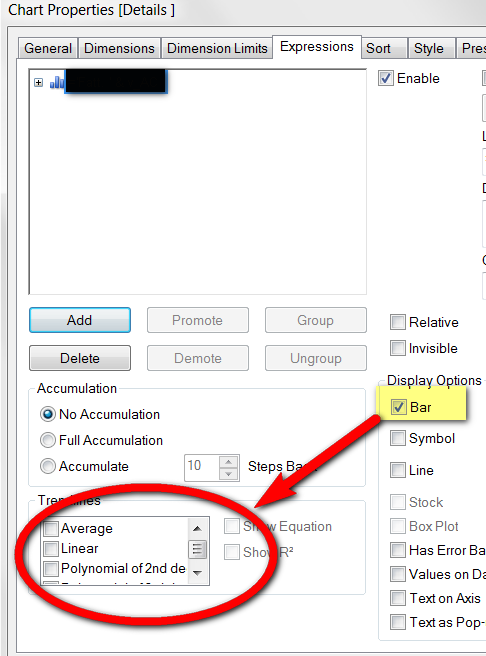
and add reference lines from the presentation tab
553 Views
Master III
2014-01-10
05:13 AM
- Mark as New
- Bookmark
- Subscribe
- Mute
- Subscribe to RSS Feed
- Permalink
- Report Inappropriate Content
Go for trendlines with splitting of the X axis
553 Views