Unlock a world of possibilities! Login now and discover the exclusive benefits awaiting you.

- Qlik Community
- :
- All Forums
- :
- QlikView
- :
- Re: How do data mapping?
- Subscribe to RSS Feed
- Mark Topic as New
- Mark Topic as Read
- Float this Topic for Current User
- Bookmark
- Subscribe
- Mute
- Printer Friendly Page

- Mark as New
- Bookmark
- Subscribe
- Mute
- Subscribe to RSS Feed
- Permalink
- Report Inappropriate Content
How do data mapping?
Who can help me map my data in a table or in a graph or a List Tect any method is valid for me please appreciate any help.
I have the following data
Row Columnes Registre
1 1 T1
2 2 T2
3 3 T3
4 4 T4
5 2 T5
| T3 | ||||
| T4 | T2 | |||
| T5 | T1 |
necesito mostralo en a table as follows:
Accepted Solutions
- Mark as New
- Bookmark
- Subscribe
- Mute
- Subscribe to RSS Feed
- Permalink
- Report Inappropriate Content
I see a duplicate post from you.
Here again is my reply.
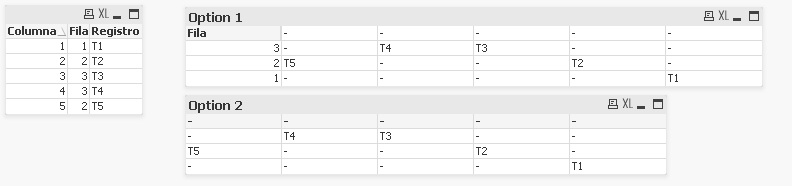
If I understood your requirement correctly, below is achived in the attached file.
- Mark as New
- Bookmark
- Subscribe
- Mute
- Subscribe to RSS Feed
- Permalink
- Report Inappropriate Content
I see a duplicate post from you.
Here again is my reply.
If I understood your requirement correctly, below is achived in the attached file.
- Mark as New
- Bookmark
- Subscribe
- Mute
- Subscribe to RSS Feed
- Permalink
- Report Inappropriate Content
Friend thank you very much, but I have trouble opening the file could help me with the images or codes, emergency nesecito thank you very much, I see your work I see it and I liked what i need, if you could help me with the information.
- Mark as New
- Bookmark
- Subscribe
- Mute
- Subscribe to RSS Feed
- Permalink
- Report Inappropriate Content
Chart Type:
* Straight Table
Dimension:
1. Fila
Expression:
1. MaxString({<Columna={5}>}Registro)
2. MaxString({<Columna={4}>}Registro)
3. MaxString({<Columna={3}>}Registro)
4. MaxString({<Columna={2}>}Registro)
5. MaxString({<Columna={1}>}Registro)
Sort:
* Fila - Numeric (Descending)
Let me know if you need more information