Unlock a world of possibilities! Login now and discover the exclusive benefits awaiting you.
Announcements
ALERT: QlikView server communication interruptions following Microsoft Windows Domain Controller security updates
- Qlik Community
- :
- All Forums
- :
- QlikView
- :
- How to build a dashboard based on interactions dat...
Options
- Subscribe to RSS Feed
- Mark Topic as New
- Mark Topic as Read
- Float this Topic for Current User
- Bookmark
- Subscribe
- Mute
- Printer Friendly Page
Turn on suggestions
Auto-suggest helps you quickly narrow down your search results by suggesting possible matches as you type.
Showing results for
Not applicable
2013-11-20
11:02 AM
- Mark as New
- Bookmark
- Subscribe
- Mute
- Subscribe to RSS Feed
- Permalink
- Report Inappropriate Content
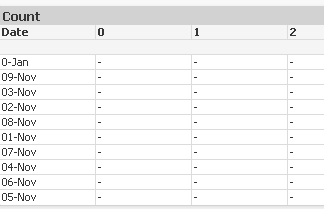
How to build a dashboard based on interactions data
I have a tabular interactions data with column headers and data below them, along with it I have another workseet which has hours in a day (starting from 0 - 23), cannot use the cross tab since can expect the data structure to change. I want to populate the count of data under each hour.So please suggest how can i do this. Below is the expected output that I am looking for.
338 Views
0 Replies