Unlock a world of possibilities! Login now and discover the exclusive benefits awaiting you.

Announcements
Q&A with Qlik - Qlik Cloud Migration: Questions about migrating to Qlik Cloud? Catch the latest replay!
- Qlik Community
- :
- All Forums
- :
- QlikView
- :
- Re: How to keep excluded values in bar chart?
Options
- Subscribe to RSS Feed
- Mark Topic as New
- Mark Topic as Read
- Float this Topic for Current User
- Bookmark
- Subscribe
- Mute
- Printer Friendly Page
Turn on suggestions
Auto-suggest helps you quickly narrow down your search results by suggesting possible matches as you type.
Showing results for

 Akina0929
Creator
2016-06-29
08:06 AM
- Mark as New
- Bookmark
- Subscribe
- Mute
- Subscribe to RSS Feed
- Permalink
- Report Inappropriate Content
How to keep excluded values in bar chart?
Hi,
My Requirement is when i select country in listbox the bar chart have to show selected country sales and excluded sales and selected value have to show different color or size.
Thank you in advance
Anji
961 Views
5 Replies

 sunny_talwar
MVP
2016-06-29
12:12 PM
- Mark as New
- Bookmark
- Subscribe
- Mute
- Subscribe to RSS Feed
- Permalink
- Report Inappropriate Content
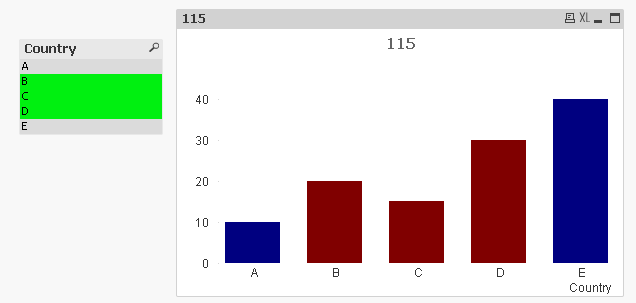
May be use an expression like this:
Sum({<Country = >}Sales)
and a background color expression like this:
If(Sum(Sales) > 0, Red(), Blue())
sunny_talwar
MVP
2016-06-29
12:14 PM
- Mark as New
- Bookmark
- Subscribe
- Mute
- Subscribe to RSS Feed
- Permalink
- Report Inappropriate Content
Sample attached
 MarcoWedel
MVP
2016-06-29
07:42 PM
- Mark as New
- Bookmark
- Subscribe
- Mute
- Subscribe to RSS Feed
- Permalink
- Report Inappropriate Content
Hi,
some similar solution:
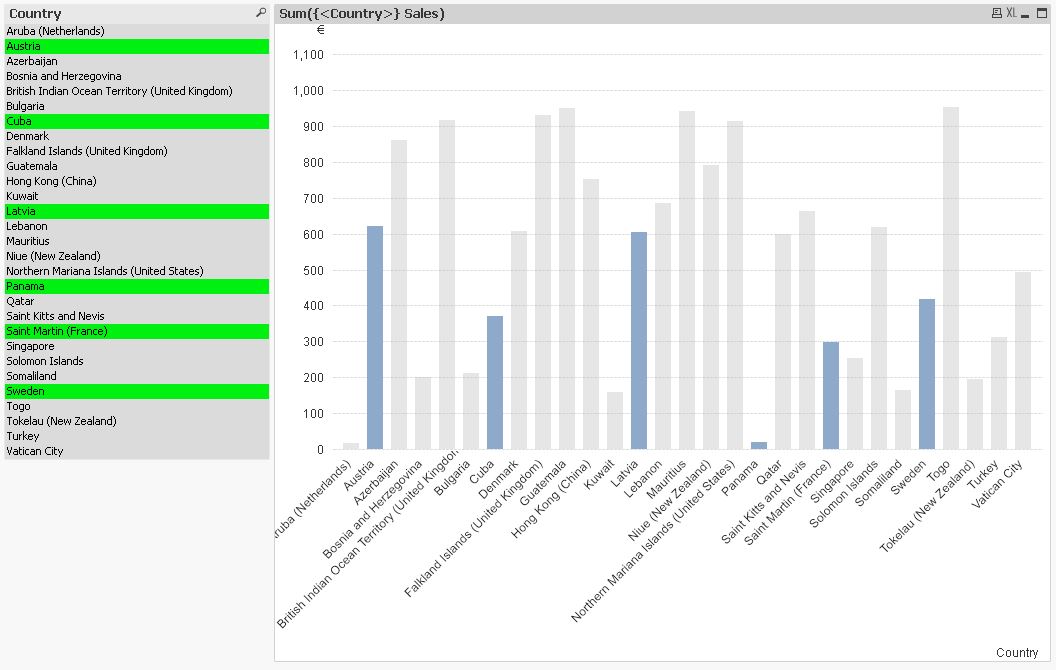
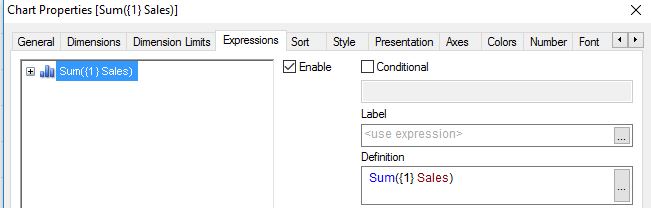
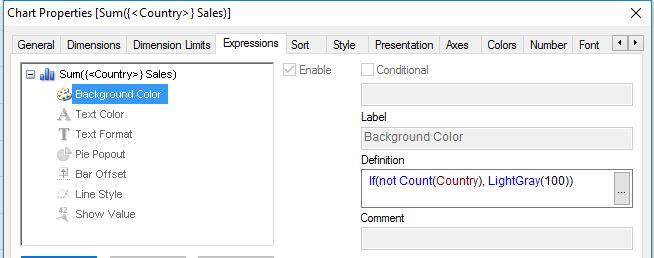
Sunny's expression might suit your requirement better though, if your chart shall still react to selections in other fields than "country".
hope this helps
regards
Marco
Akina0929
Creator
2016-06-30
01:41 AM
Author
- Mark as New
- Bookmark
- Subscribe
- Mute
- Subscribe to RSS Feed
- Permalink
- Report Inappropriate Content
Thank you
813 Views
MarcoWedel
MVP
2016-06-30
04:48 PM
- Mark as New
- Bookmark
- Subscribe
- Mute
- Subscribe to RSS Feed
- Permalink
- Report Inappropriate Content
you're welcome.
please close this thread if your question is answered.
thanks
regards
Marco
813 Views
