Unlock a world of possibilities! Login now and discover the exclusive benefits awaiting you.

- Qlik Community
- :
- All Forums
- :
- QlikView
- :
- Re: How to make this chart?
Options
- Subscribe to RSS Feed
- Mark Topic as New
- Mark Topic as Read
- Float this Topic for Current User
- Bookmark
- Subscribe
- Mute
- Printer Friendly Page
Turn on suggestions
Auto-suggest helps you quickly narrow down your search results by suggesting possible matches as you type.
Showing results for

Anonymous
Not applicable
2013-07-29
09:49 PM
- Mark as New
- Bookmark
- Subscribe
- Mute
- Subscribe to RSS Feed
- Permalink
- Report Inappropriate Content
How to make this chart?
Hi experts,
I am looking to create a new chart in qlikview similar to below image
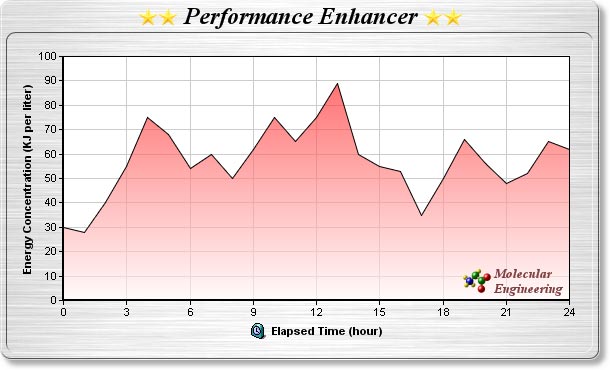
How can I make this chart work in qlikview?
- Tags:
- new_to_qlikview
662 Views
1 Solution
Accepted Solutions

 Sokkorn
Master
2013-07-29
09:57 PM
- Mark as New
- Bookmark
- Subscribe
- Mute
- Subscribe to RSS Feed
- Permalink
- Report Inappropriate Content
Hi Heap,
Try this:
1. Create a line chart with your dimension and expression
2. In "Style tab" choose Option below
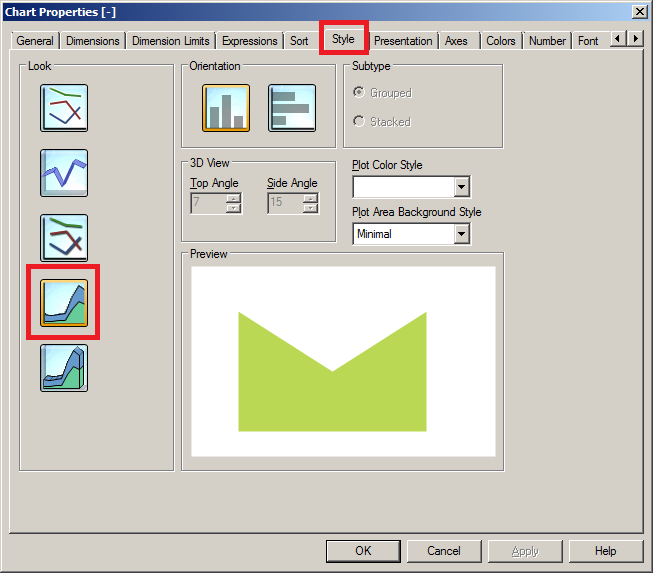
3. In "Presentation tab" check on "Semi-transparent"
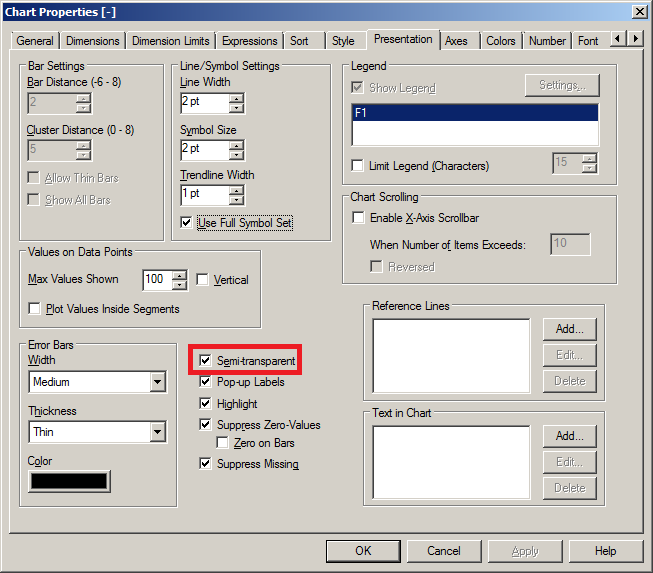
That done.
Regards,
Sokkorn
503 Views
1 Reply
Sokkorn
Master
2013-07-29
09:57 PM
- Mark as New
- Bookmark
- Subscribe
- Mute
- Subscribe to RSS Feed
- Permalink
- Report Inappropriate Content
Hi Heap,
Try this:
1. Create a line chart with your dimension and expression
2. In "Style tab" choose Option below
3. In "Presentation tab" check on "Semi-transparent"
That done.
Regards,
Sokkorn
504 Views