Unlock a world of possibilities! Login now and discover the exclusive benefits awaiting you.

- Qlik Community
- :
- All Forums
- :
- QlikView
- :
- Re: How to split the expression based on some cond...
- Subscribe to RSS Feed
- Mark Topic as New
- Mark Topic as Read
- Float this Topic for Current User
- Bookmark
- Subscribe
- Mute
- Printer Friendly Page

- Mark as New
- Bookmark
- Subscribe
- Mute
- Subscribe to RSS Feed
- Permalink
- Report Inappropriate Content
How to split the expression based on some condition?
Dear Experts,
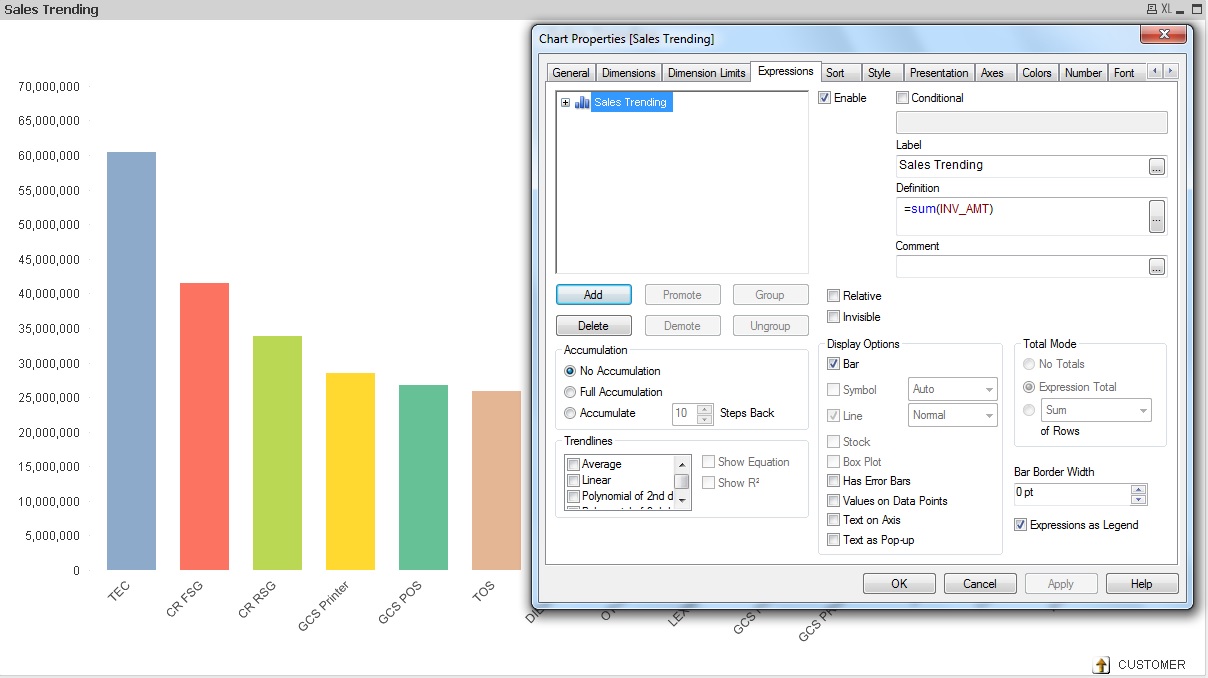
Our current Chart designed as below.
Dimension : 12 Customers (X-Axis)
Expression : Total sales amount for the last 3 years (Y-Axis)
But our exact requirement is to split the expression by showing 3 individual year total sales for each customer. So that we can see the trend easily.
Kindly advise.
Thanks,
Saravanan
Accepted Solutions

 swuehl
- Mark as New
- Bookmark
- Subscribe
- Mute
- Subscribe to RSS Feed
- Permalink
- Report Inappropriate Content
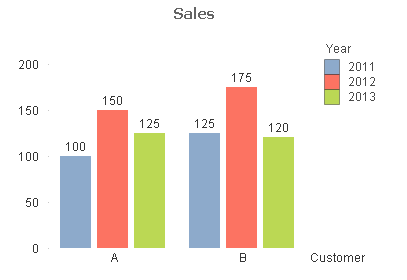
Maybe just use a second dimension Year in your chart?
And then choose either stacked or grouped style on style tab?
- Mark as New
- Bookmark
- Subscribe
- Mute
- Subscribe to RSS Feed
- Permalink
- Report Inappropriate Content
swuehl
- Mark as New
- Bookmark
- Subscribe
- Mute
- Subscribe to RSS Feed
- Permalink
- Report Inappropriate Content
Maybe just use a second dimension Year in your chart?
And then choose either stacked or grouped style on style tab?

 HirisH_V7
- Mark as New
- Bookmark
- Subscribe
- Mute
- Subscribe to RSS Feed
- Permalink
- Report Inappropriate Content
Hi,
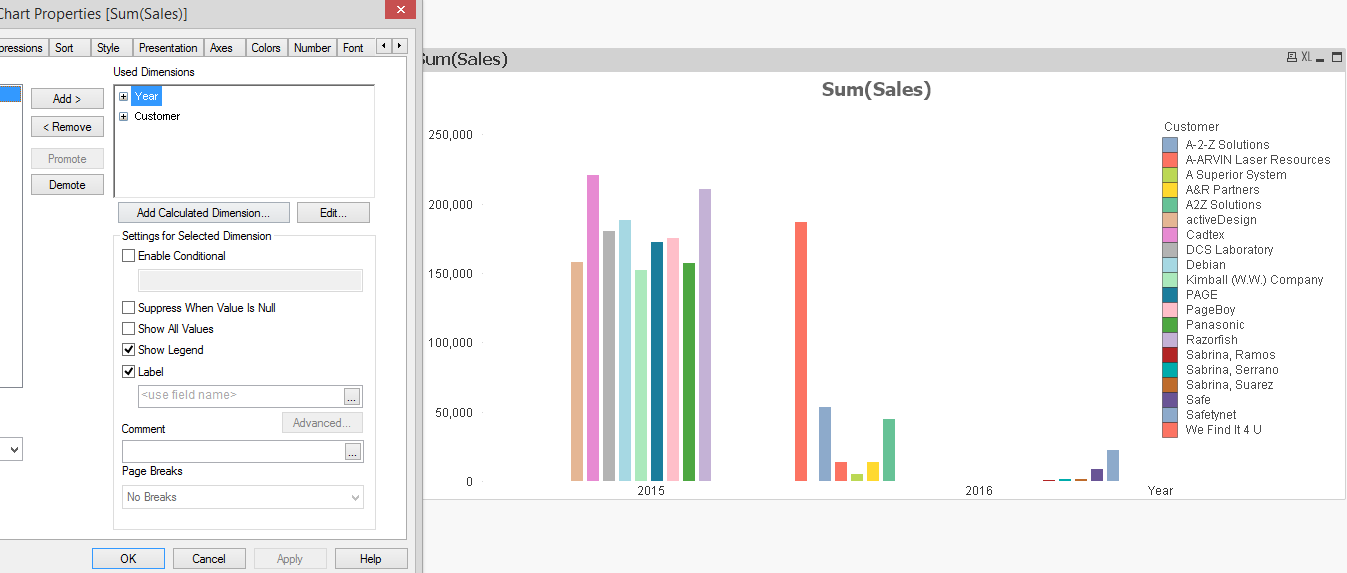
Make Year as your First Dimension and Customer as second Dimension Like this,
HTH,
Hirish

 Kushal_Chawda
- Mark as New
- Bookmark
- Subscribe
- Mute
- Subscribe to RSS Feed
- Permalink
- Report Inappropriate Content
like this?