Unlock a world of possibilities! Login now and discover the exclusive benefits awaiting you.

- Qlik Community
- :
- All Forums
- :
- QlikView
- :
- In chart text colour conditioning
Options
- Subscribe to RSS Feed
- Mark Topic as New
- Mark Topic as Read
- Float this Topic for Current User
- Bookmark
- Subscribe
- Mute
- Printer Friendly Page
Turn on suggestions
Auto-suggest helps you quickly narrow down your search results by suggesting possible matches as you type.
Showing results for

 aaronnayan
Creator III
2017-07-06
08:51 AM
- Mark as New
- Bookmark
- Subscribe
- Mute
- Subscribe to RSS Feed
- Permalink
- Report Inappropriate Content
In chart text colour conditioning
Hi Guys
I have an expression its not coming out right
Metrics
0-50= RED
51-70= YELLOW
70-90=GREEN
90+= BLUE
This is whats coming out currently
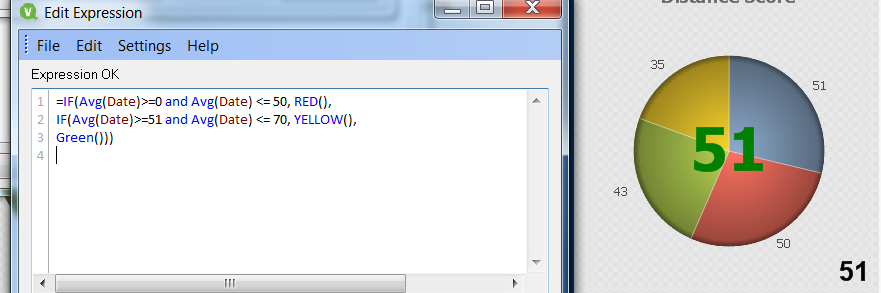
Can anyone help with this
If you could write the correct expression it will help significantly 
- Tags:
- bi developer
- chart
- coding
- colour
- conditioning
- data
- expression
- help
- load
- new to qlikview
- new_to_qlikview
- pie chart
- qlikview
- script
- visual analytics
1,689 Views
4 Replies

 Frank_Hartmann
Master II
2017-07-06
08:59 AM
- Mark as New
- Bookmark
- Subscribe
- Mute
- Subscribe to RSS Feed
- Permalink
- Report Inappropriate Content
can you upload a small sample?
1,588 Views

 dberkesacn
Partner - Creator III
2017-07-06
09:02 AM
- Mark as New
- Bookmark
- Subscribe
- Mute
- Subscribe to RSS Feed
- Permalink
- Report Inappropriate Content
When you making the avg you have to use agg function.
if(aggr(sum(Value),Dim)/aggr(Count(Value),Dim)<10,red(),Green())
1,588 Views
aaronnayan
Creator III
2017-07-06
09:06 AM
Author
- Mark as New
- Bookmark
- Subscribe
- Mute
- Subscribe to RSS Feed
- Permalink
- Report Inappropriate Content
This 51 should be yellow but it is not
1,588 Views


2017-07-06
09:06 AM
- Mark as New
- Bookmark
- Subscribe
- Mute
- Subscribe to RSS Feed
- Permalink
- Report Inappropriate Content
Can you try this?
If(Avg(Date) >= 0 and Avg(Date) <= 50, Red(), If(Avg(Date) >= 51 and Avg(Date) <= 70, Yellow(), If(Avg(Date) >= 71 and Avg(Date) <= 90, Green(), Blue())))
But, I doubt how Avg(Date) given the values to you?
Best Anil, When applicable please mark the correct/appropriate replies as "solution" (you can mark up to 3 "solutions". Please LIKE threads if the provided solution is helpful
