Unlock a world of possibilities! Login now and discover the exclusive benefits awaiting you.
- Qlik Community
- :
- All Forums
- :
- QlikView
- :
- Re: Interactive Product Mix Planning
- Subscribe to RSS Feed
- Mark Topic as New
- Mark Topic as Read
- Float this Topic for Current User
- Bookmark
- Subscribe
- Mute
- Printer Friendly Page
- Mark as New
- Bookmark
- Subscribe
- Mute
- Subscribe to RSS Feed
- Permalink
- Report Inappropriate Content
Interactive Product Mix Planning
Trying to create a dashboard that would allow different product mixes to tested.
Sales Example:
| Product Category | 2013 | 2014 | 2015 |
| A | 468 | 957 | 820 |
| B | 834 | 275 | 356 |
| C | 907 | 870 | 224 |
| D | 174 | 458 | 338 |
| E | 3,741 | 9,952 | 6,439 |
| F | 68 | 97 | 71 |
| G | 581 | 889 | 508 |
| Total | 6,773 | 13,498 | 8,756 |
Average Mix:
| Product Category | Avg |
| A | 748 |
| B | 488 |
| C | 667 |
| D | 323 |
| E | 6,711 |
| F | 79 |
| G | 659 |
| Total | 9,676 |
Converted to Percent
| Product Category | Std Mix |
| A | 8% |
| B | 5% |
| C | 7% |
| D | 3% |
| E | 69% |
| F | 1% |
| G | 7% |
New Company Goal = 12% over last year (8,756 * 1.12) = 9,807
Redistribute to find goals per product category
| Product Category | Standard |
| A | 758 |
| B | 495 |
| C | 676 |
| D | 328 |
| E | 6,802 |
| F | 80 |
| G | 668 |
Now for the difficult bit. Using the Standard Product Mix the calculated growth per category is:
| Product Category | Planned Growth |
| A | 92% |
| B | 139% |
| C | 302% |
| D | 97% |
| E | 106% |
| F | 112% |
| G | 132% |
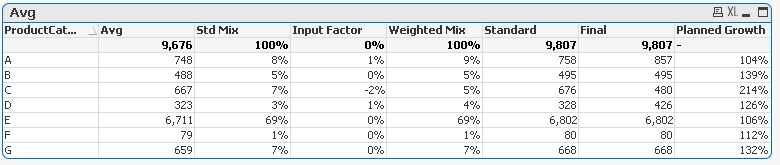
Product Lines A & D are projected to grow less than 100% of the previous year's sales. Whereas Product Line C is expected to sell three times as much as the previous year. So I would like to add an adjustment factor into the mix.
| Product Category | Std Mix | Adj Factor | Weighted Mix | Final | Planned Growth |
| A | 8% | 1 | 9% | 857 | 104% |
| B | 5% | 0 | 5% | 495 | 139% |
| C | 7% | -2 | 5% | 480 | 214% |
| D | 3% | 1 | 4% | 426 | 126% |
| E | 69% | 0 | 69% | 6,802 | 106% |
| F | 1% | 0 | 1% | 80 | 112% |
| G | 7% | 0 | 7% | 668 | 132% |
| Total | 1 | - | 1 | 9,807 |
I have attached the complete example in Excel and also a start to the QlikView App. I am able to achieve the desired results via load script, but would like to create an interactive version. Anybody want to give it a try?
Accepted Solutions
- Mark as New
- Bookmark
- Subscribe
- Mute
- Subscribe to RSS Feed
- Permalink
- Report Inappropriate Content
- Mark as New
- Bookmark
- Subscribe
- Mute
- Subscribe to RSS Feed
- Permalink
- Report Inappropriate Content
Something like this?