Unlock a world of possibilities! Login now and discover the exclusive benefits awaiting you.

- Qlik Community
- :
- All Forums
- :
- QlikView
- :
- Re: Is This Possible?
- Subscribe to RSS Feed
- Mark Topic as New
- Mark Topic as Read
- Float this Topic for Current User
- Bookmark
- Subscribe
- Mute
- Printer Friendly Page

- Mark as New
- Bookmark
- Subscribe
- Mute
- Subscribe to RSS Feed
- Permalink
- Report Inappropriate Content
Is This Possible?
Hi All
I have been searching for the option through which I can get a Dashboard like the one attached here. I want you to fucus on getting the Product categories(Kitchen,Home Interior,Gadgets) under Product (not adjacent to it) and futher things in product categories under it .

Accepted Solutions

 swuehl
- Mark as New
- Bookmark
- Subscribe
- Mute
- Subscribe to RSS Feed
- Permalink
- Report Inappropriate Content
Maybe like attached, using a pivot table in indent mode.
Or look into something like described here:
How to Create a Profit and Loss Statement in QlikView
edit:
Missed that you are using PE, so here is what I did:
Script:
LOAD * INLINE [
Product Group, Product, Description
Kitchen, Spoon, Steel
Kitchen, Cooker, Hot
Kitchen, Plate, Steel
Kitchen, Knife, Sharp
Gadgets, Mouse, Tiny
Gadgets, Keyboard, Keys
Gadgets, Monitor, Large
];
to load some sample data.
Then create a pivot table with dimensions, Product Group and Product.
Use
=if(Dimensionality()>1,only(Description),' ')
as expression.
Use indent mode on style tab and 'subtotals on top' on presentation tab.

 DavidFoster1
- Mark as New
- Bookmark
- Subscribe
- Mute
- Subscribe to RSS Feed
- Permalink
- Report Inappropriate Content
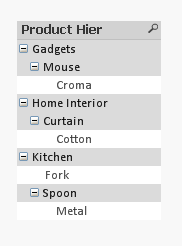
One option would be to use the treeview option in the listbox object.
- Mark as New
- Bookmark
- Subscribe
- Mute
- Subscribe to RSS Feed
- Permalink
- Report Inappropriate Content
Thanks
I am using a personal edition so I am unable to open the attached file .Also I want to use this in a pivot table .Not in list box ,If that is possible ?

 sujeetsingh
- Mark as New
- Bookmark
- Subscribe
- Mute
- Subscribe to RSS Feed
- Permalink
- Report Inappropriate Content
Better go with image and assign triggers if possible.
- Mark as New
- Bookmark
- Subscribe
- Mute
- Subscribe to RSS Feed
- Permalink
- Report Inappropriate Content
Thanks.
Any suggestions then?
swuehl
- Mark as New
- Bookmark
- Subscribe
- Mute
- Subscribe to RSS Feed
- Permalink
- Report Inappropriate Content
Maybe like attached, using a pivot table in indent mode.
Or look into something like described here:
How to Create a Profit and Loss Statement in QlikView
edit:
Missed that you are using PE, so here is what I did:
Script:
LOAD * INLINE [
Product Group, Product, Description
Kitchen, Spoon, Steel
Kitchen, Cooker, Hot
Kitchen, Plate, Steel
Kitchen, Knife, Sharp
Gadgets, Mouse, Tiny
Gadgets, Keyboard, Keys
Gadgets, Monitor, Large
];
to load some sample data.
Then create a pivot table with dimensions, Product Group and Product.
Use
=if(Dimensionality()>1,only(Description),' ')
as expression.
Use indent mode on style tab and 'subtotals on top' on presentation tab.
- Mark as New
- Bookmark
- Subscribe
- Mute
- Subscribe to RSS Feed
- Permalink
- Report Inappropriate Content
I am new to qv so can you please elaborate over it?