Unlock a world of possibilities! Login now and discover the exclusive benefits awaiting you.

Announcements
Want to see what's currently in public preview? We've pulled it all together in one place. Check it out here
- Qlik Community
- :
- All Forums
- :
- QlikView
- :
- Layout help - Consumer bucket movement
Options
- Subscribe to RSS Feed
- Mark Topic as New
- Mark Topic as Read
- Float this Topic for Current User
- Bookmark
- Subscribe
- Mute
- Printer Friendly Page
Turn on suggestions
Auto-suggest helps you quickly narrow down your search results by suggesting possible matches as you type.
Showing results for

 twanqlik
Creator II
2018-08-13
06:26 AM
- Mark as New
- Bookmark
- Subscribe
- Mute
- Subscribe to RSS Feed
- Permalink
- Report Inappropriate Content
Layout help - Consumer bucket movement
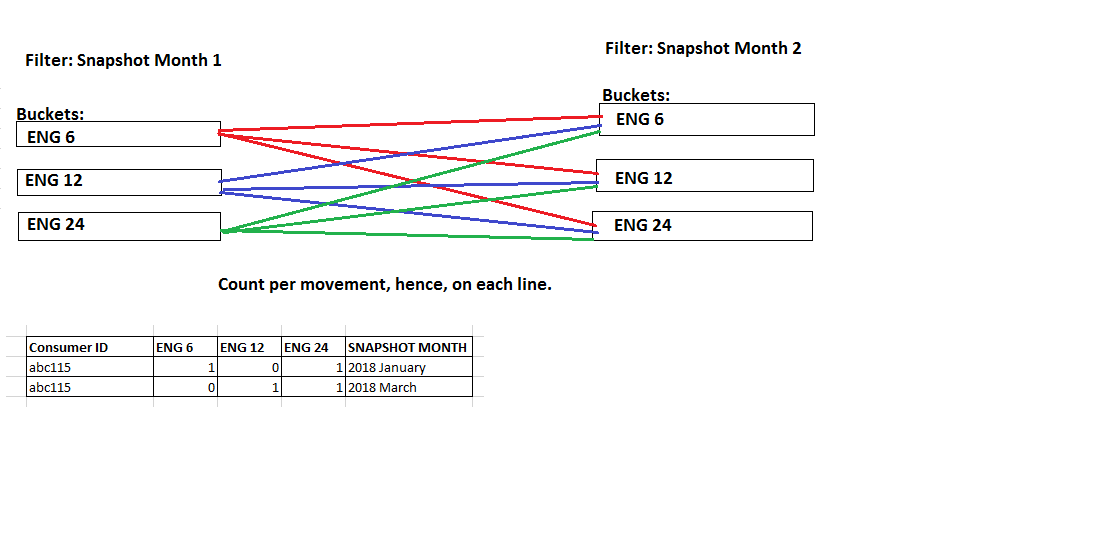
I could use some help in visualizing the below image.
Request from the user:
Filter on Snapshot month 1 --> Example 2018 January
Filter on Snapshot month 2 --> Example 2018 March
Check the flow of the consumers.
How many consumers from January 2018, have moved from ENG6 to ENG 12
Etc.
I tried to use the Sankey diagram, but that didn't really work out.
I'm open for all kind of visualization options!
*And also how to calculate this on the front-end 
554 Views
0 Replies
