Unlock a world of possibilities! Login now and discover the exclusive benefits awaiting you.

- Qlik Community
- :
- All Forums
- :
- QlikView
- :
- Re: Line Chart Dimensions on X & Y Axis
Options
- Subscribe to RSS Feed
- Mark Topic as New
- Mark Topic as Read
- Float this Topic for Current User
- Bookmark
- Subscribe
- Mute
- Printer Friendly Page
Turn on suggestions
Auto-suggest helps you quickly narrow down your search results by suggesting possible matches as you type.
Showing results for

Not applicable
2016-06-17
10:06 AM
- Mark as New
- Bookmark
- Subscribe
- Mute
- Subscribe to RSS Feed
- Permalink
- Report Inappropriate Content
Line Chart Dimensions on X & Y Axis
Is there any way to build a line chart with dimensions on the x & y axis? I have mocked up what I want the chart to look like using a straight table with a mini chart, but I need the x-axis to be Months grouped by quarter, the y-axis to have the measure scale (total sales), and it needs to be a line not a bar.
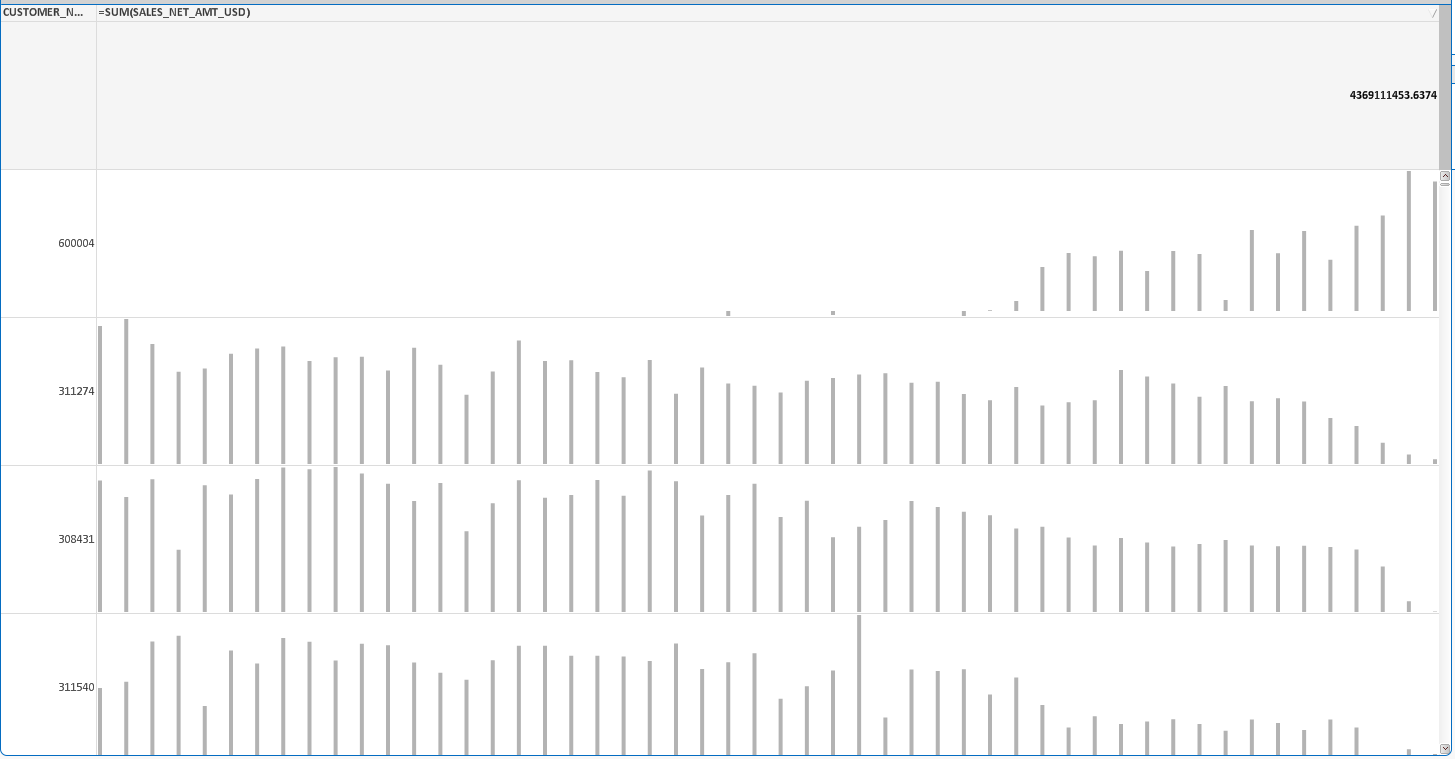
I can do this easily in Tableau, but can't figure out a way in QV.
Thanks!
1,551 Views
1 Solution
Accepted Solutions

 Clever_Anjos
Support
2016-06-17
10:45 AM
- Mark as New
- Bookmark
- Subscribe
- Mute
- Subscribe to RSS Feed
- Permalink
- Report Inappropriate Content
Please check if Trellis feature solve your needs
2 Replies
Clever_Anjos
Support
2016-06-17
10:45 AM
- Mark as New
- Bookmark
- Subscribe
- Mute
- Subscribe to RSS Feed
- Permalink
- Report Inappropriate Content
Please check if Trellis feature solve your needs
Not applicable
2016-06-23
02:53 PM
Author
- Mark as New
- Bookmark
- Subscribe
- Mute
- Subscribe to RSS Feed
- Permalink
- Report Inappropriate Content
Not the format I was hoping for (takes of too much real estate) but it does the job, Thanks!