Unlock a world of possibilities! Login now and discover the exclusive benefits awaiting you.
Announcements
ALERT: QlikView server communication interruptions following Microsoft Windows Domain Controller security updates
- Qlik Community
- :
- All Forums
- :
- QlikView
- :
- Re: Line Chart - Timestamps
Options
- Subscribe to RSS Feed
- Mark Topic as New
- Mark Topic as Read
- Float this Topic for Current User
- Bookmark
- Subscribe
- Mute
- Printer Friendly Page
Turn on suggestions
Auto-suggest helps you quickly narrow down your search results by suggesting possible matches as you type.
Showing results for
Not applicable
2016-12-16
11:05 AM
- Mark as New
- Bookmark
- Subscribe
- Mute
- Subscribe to RSS Feed
- Permalink
- Report Inappropriate Content
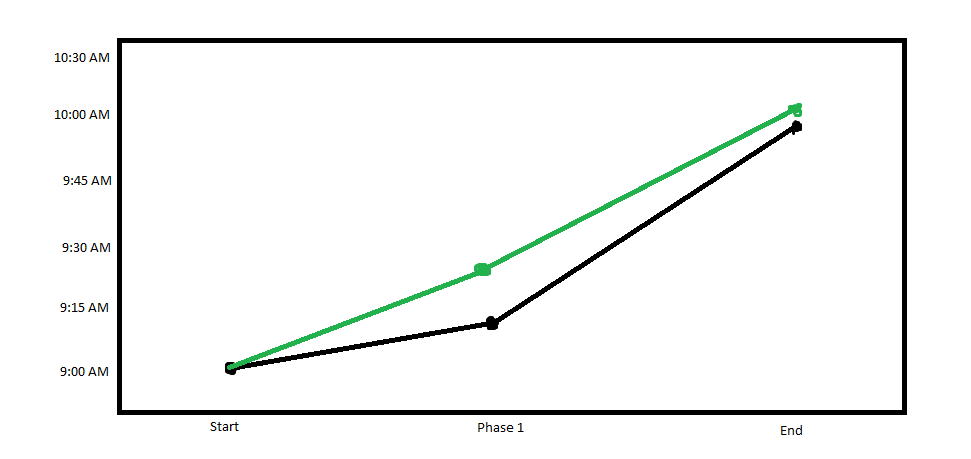
Line Chart - Timestamps
I am trying to plot a line chart with timestamps. It should show the time on the Y-axis and the table headers on the X-axis. Is this possible?
The attached screenshot shows what I am trying to achieve. There is a separate table for SLA that should also be shown on the chart (green line in screenshot) so that it can be compared. Is this something that is do-able using the line chart in Qlikview? Or is there a better method to depict this?
3,818 Views
- « Previous Replies
-
- 1
- 2
- Next Replies »
10 Replies
Not applicable
2016-12-22
10:36 AM
Author
- Mark as New
- Bookmark
- Subscribe
- Mute
- Subscribe to RSS Feed
- Permalink
- Report Inappropriate Content
A table with SLA times can be made but seems redundant.
351 Views
- « Previous Replies
-
- 1
- 2
- Next Replies »