Unlock a world of possibilities! Login now and discover the exclusive benefits awaiting you.

- Qlik Community
- :
- All Forums
- :
- QlikView
- :
- Re: Linear Gauge in Straight Table
- Subscribe to RSS Feed
- Mark Topic as New
- Mark Topic as Read
- Float this Topic for Current User
- Bookmark
- Subscribe
- Mute
- Printer Friendly Page

- Mark as New
- Bookmark
- Subscribe
- Mute
- Subscribe to RSS Feed
- Permalink
- Report Inappropriate Content
Linear Gauge in Straight Table
Hi,
I have built a linear gauge into a Straight table but my segments do not seem to be displaying correctly.
My linear gauge is based on a 1-100% scale where I break the segments up with an Actual % figure, I also have a needle present for a budget% figure but this is working correctly.
My issue is that my segment doesn't show the correct colours unless I click on my linear gauge in which case it is then fine. Is there some way I can make the segments show in different colours when I have nothing selected??
When nothing is selected my gauges show the following:
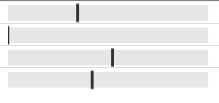
But when I drill down it appears like like this, (desired outcome):



 cheburashka
- Mark as New
- Bookmark
- Subscribe
- Mute
- Subscribe to RSS Feed
- Permalink
- Report Inappropriate Content
Hello,
I think im looking for a similar solution.
After some tests I concluded that the lower bound of segment 2 isn't independently calculated for each row in your table.
My table looks like this :
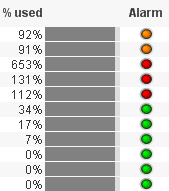
And i want it to look like this:
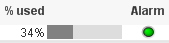

Did you do some extra tests?
,KR Koen