Unlock a world of possibilities! Login now and discover the exclusive benefits awaiting you.

- Qlik Community
- :
- All Forums
- :
- QlikView
- :
- Re: Make a variable equal to a value range (0-100)
- Subscribe to RSS Feed
- Mark Topic as New
- Mark Topic as Read
- Float this Topic for Current User
- Bookmark
- Subscribe
- Mute
- Printer Friendly Page

 Nora104
- Mark as New
- Bookmark
- Subscribe
- Mute
- Subscribe to RSS Feed
- Permalink
- Report Inappropriate Content
Make a variable equal to a value range (0-100)
Hi,
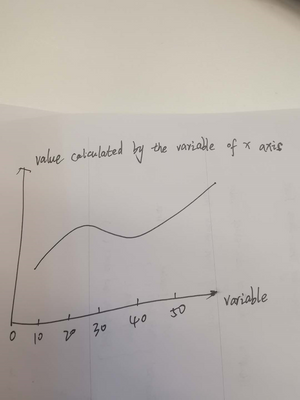
I want to make a line chart: X axis is a variable(0-100), Y axis is a value changed with the variable of X axis.
How can I make the variable be a value range(0-100)?
Accepted Solutions

- Mark as New
- Bookmark
- Subscribe
- Mute
- Subscribe to RSS Feed
- Permalink
- Report Inappropriate Content
Are you looking something like this? For example, Y=Sin(X) where X = 0 to 100
tab1:
LOAD IterNo() As X, Sin(IterNo()) As Y
AutoGenerate 1
While IterNo()<=100
;

 rubenmarin
- Mark as New
- Bookmark
- Subscribe
- Mute
- Subscribe to RSS Feed
- Permalink
- Report Inappropriate Content
Hi, I'm not sure of what data you have... In the Axis tab of the chart you can se a static min and stactic max.
You can use a variable to set any of the values using $(VariableName).
Also you can use an expression like Max([Expression_For_X_Axis]) to set the static max. Use Min() for the static min.
- Mark as New
- Bookmark
- Subscribe
- Mute
- Subscribe to RSS Feed
- Permalink
- Report Inappropriate Content
Are you looking something like this? For example, Y=Sin(X) where X = 0 to 100
tab1:
LOAD IterNo() As X, Sin(IterNo()) As Y
AutoGenerate 1
While IterNo()<=100
;
 PerkyBadger
- Mark as New
- Bookmark
- Subscribe
- Mute
- Subscribe to RSS Feed
- Permalink
- Report Inappropriate Content
Looking great work dear, I really appreciated to you on this quality work. Nice post!!
Nora104
- Mark as New
- Bookmark
- Subscribe
- Mute
- Subscribe to RSS Feed
- Permalink
- Report Inappropriate Content
It is just what I want. But I wonder if it can be done by variable so that the max value 100 can be changed easily. But I guess this way is good enough for my use.
Thank you!
Nora104
- Mark as New
- Bookmark
- Subscribe
- Mute
- Subscribe to RSS Feed
- Permalink
- Report Inappropriate Content
Thank you.
But I am a little confused. I don't know whether what you say can solve my problem.
