Unlock a world of possibilities! Login now and discover the exclusive benefits awaiting you.

- Qlik Community
- :
- All Forums
- :
- QlikView
- :
- Re: Median on Ref data Line
- Subscribe to RSS Feed
- Mark Topic as New
- Mark Topic as Read
- Float this Topic for Current User
- Bookmark
- Subscribe
- Mute
- Printer Friendly Page

- Mark as New
- Bookmark
- Subscribe
- Mute
- Subscribe to RSS Feed
- Permalink
- Report Inappropriate Content
Median on Ref data Line
I have created a chart with below sample values for 4 months.
Date, Count of Sales
1-Jan-12,10
2-Jan-12,11
.
15-Feb-12,50
.
30-Mar-12,35
.
30-Apr-12,1000
Later I created a graph to calculate monthly total of sales using dimension as = Month(Date) &"-" & Year(Date).
Now If I have to add median/avg line of Monthly sale on this chart how to get it added?
When I created simple graph of date Vs Count, I was able to add Two refernce lines using Avg(Count of Sales) and Median(Count of Sales) functions for reference line of graph.
But when I create monthly aggregation of data, I don't know how to add correct "avg/median function" for this table.
Any help will be appreciated.
- Tags:
- new_to_qlikview
- Mark as New
- Bookmark
- Subscribe
- Mute
- Subscribe to RSS Feed
- Permalink
- Report Inappropriate Content
Ok Avg is solved. I found the answer already. Really sorry to put this question on QV forum.
- Mark as New
- Bookmark
- Subscribe
- Mute
- Subscribe to RSS Feed
- Permalink
- Report Inappropriate Content
can teach me hw to add a median line on my scatter graph?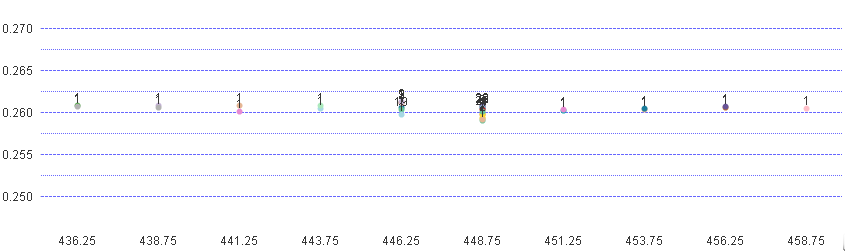
i would like to add a median like which is accross all the points.