Unlock a world of possibilities! Login now and discover the exclusive benefits awaiting you.

- Qlik Community
- :
- All Forums
- :
- QlikView
- :
- Re: Multiple Y Expressions\Double Y-axis Scatter P...
- Subscribe to RSS Feed
- Mark Topic as New
- Mark Topic as Read
- Float this Topic for Current User
- Bookmark
- Subscribe
- Mute
- Printer Friendly Page

- Mark as New
- Bookmark
- Subscribe
- Mute
- Subscribe to RSS Feed
- Permalink
- Report Inappropriate Content
Multiple Y Expressions\Double Y-axis Scatter Plot
Hello Community,
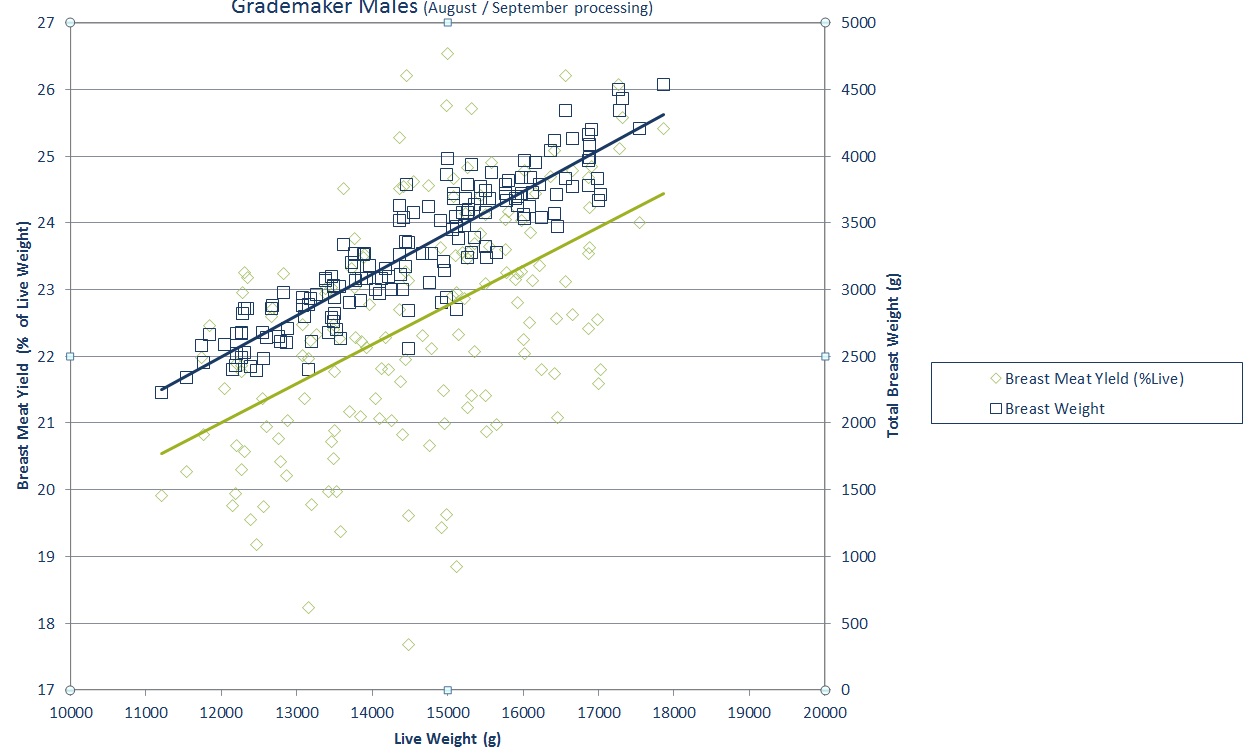
I am new to Qlikview and wanted to convert some of my excel document to train myself. I am stuck on the graph below. It is a scatter plot with the same unique Dimension and has two different variables (Breast meat yield (%), and breast meat yield Weight) expressed on the Live Weight. In Qlikview I can only get 1 y-axis on scatter plot  . Any help is appreciated!
Jarl
- « Previous Replies
-
- 1
- 2
- Next Replies »
.png "f_rankie")
 f_rankie
- Mark as New
- Bookmark
- Subscribe
- Mute
- Subscribe to RSS Feed
- Permalink
- Report Inappropriate Content
I have the same challenge as Jarl: Creating a Scatterplot with two different Y-axes.
Therefore, I'd like to push this thread up. Even a definitive answer that it is (currently) not possible would be helpful.
Thanks,
Frank

 rbecher
- Mark as New
- Bookmark
- Subscribe
- Mute
- Subscribe to RSS Feed
- Permalink
- Report Inappropriate Content
It is currently not possible. Could be possible in an extension, though.
- Ralf
- « Previous Replies
-
- 1
- 2
- Next Replies »