Unlock a world of possibilities! Login now and discover the exclusive benefits awaiting you.
- Qlik Community
- :
- All Forums
- :
- QlikView
- :
- Re: Need help on Gauge Chart design
- Subscribe to RSS Feed
- Mark Topic as New
- Mark Topic as Read
- Float this Topic for Current User
- Bookmark
- Subscribe
- Mute
- Printer Friendly Page
- Mark as New
- Bookmark
- Subscribe
- Mute
- Subscribe to RSS Feed
- Permalink
- Report Inappropriate Content
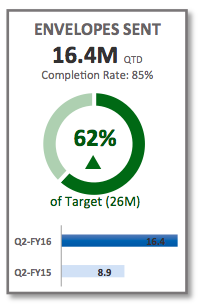
Need help on Gauge Chart design
Is there a way to create a Gauge chart as shown below with slight gaps showing ?
- Tags:
- gauge chart
Accepted Solutions
- Mark as New
- Bookmark
- Subscribe
- Mute
- Subscribe to RSS Feed
- Permalink
- Report Inappropriate Content
- Mark as New
- Bookmark
- Subscribe
- Mute
- Subscribe to RSS Feed
- Permalink
- Report Inappropriate Content
starting from the bottom
- bar chart
- gauge, you can find some example and a qlik doc here
Dislike gauge charts? You may want to give them a second chance
- some textbox with different font sizes
so you can but not with a single chart
- Mark as New
- Bookmark
- Subscribe
- Mute
- Subscribe to RSS Feed
- Permalink
- Report Inappropriate Content
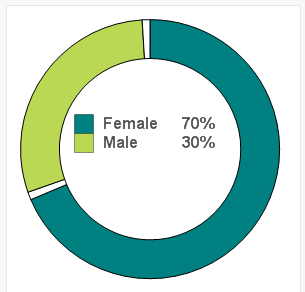
you can achieve it using a PIE chart to some extent. Please see the example attached.
- Mark as New
- Bookmark
- Subscribe
- Mute
- Subscribe to RSS Feed
- Permalink
- Report Inappropriate Content
hi Gerry,
i have a solution for this, hope it may work instead of going for gauge chart go for Pie chart.
1. Select the style similar looking to doughnut.
2. You will be having one expression consider it as exp1 and create second exp which would be 1-exp1 and check mark relative value.
3. then in pie popout option within expression1 put value as 5.
hope u may get to what you wanted.
Regards
Saurabh
- Mark as New
- Bookmark
- Subscribe
- Mute
- Subscribe to RSS Feed
- Permalink
- Report Inappropriate Content
Gerry,
Hopefully this will get you on the right track.
- Mark as New
- Bookmark
- Subscribe
- Mute
- Subscribe to RSS Feed
- Permalink
- Report Inappropriate Content
ok very cool indeed ...
Yes, it gets me started
Let me know where to send the box of chocolates 
Gerry.
- Mark as New
- Bookmark
- Subscribe
- Mute
- Subscribe to RSS Feed
- Permalink
- Report Inappropriate Content
Glad to help!