Unlock a world of possibilities! Login now and discover the exclusive benefits awaiting you.

- Qlik Community
- :
- All Forums
- :
- QlikView
- :
- Re: Overview - How to built?
- Subscribe to RSS Feed
- Mark Topic as New
- Mark Topic as Read
- Float this Topic for Current User
- Bookmark
- Subscribe
- Mute
- Printer Friendly Page

- Mark as New
- Bookmark
- Subscribe
- Mute
- Subscribe to RSS Feed
- Permalink
- Report Inappropriate Content
Overview - How to built?
I have an order and a users tabel in my database:

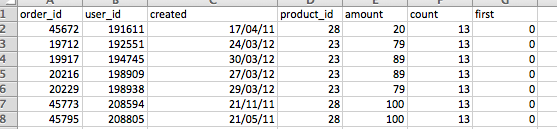
Now on my general overview sheet I want to create a box with some of our key numbers:
(I made a mockup)
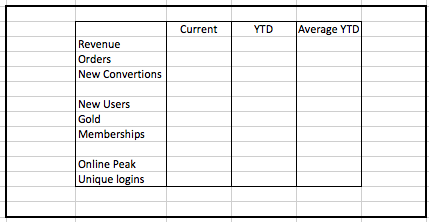
But I can't figure out how to start and which object to use:
I know that:
Revenue = Sum(amount)
Orders = count(distinct(order_id))
New Convertions = sum(first)
New users = count(distinct(user_id)
I have a problem figuring out how to count Gold and Memberships because these should display the overall number on a specific day(where the other show the number for that day)
- How many users are gold & how many memberships are active
How do I get started and what object do I use?
- « Previous Replies
-
- 1
- 2
- Next Replies »
- Mark as New
- Bookmark
- Subscribe
- Mute
- Subscribe to RSS Feed
- Permalink
- Report Inappropriate Content
I haven't figured this out yet, and I don't fully understand what you want me to do?
- Mark as New
- Bookmark
- Subscribe
- Mute
- Subscribe to RSS Feed
- Permalink
- Report Inappropriate Content
Hi Spigoworld,
Extremely sorry for the delay in reply...
Please go through the data visualization example->Butterfly tab in the qlikview folder..
- « Previous Replies
-
- 1
- 2
- Next Replies »