Unlock a world of possibilities! Login now and discover the exclusive benefits awaiting you.

- Qlik Community
- :
- All Forums
- :
- QlikView
- :
- Re: Pareto Chart
- Subscribe to RSS Feed
- Mark Topic as New
- Mark Topic as Read
- Float this Topic for Current User
- Bookmark
- Subscribe
- Mute
- Printer Friendly Page

 sreelathamohan
- Mark as New
- Bookmark
- Subscribe
- Mute
- Subscribe to RSS Feed
- Permalink
- Report Inappropriate Content
Pareto Chart
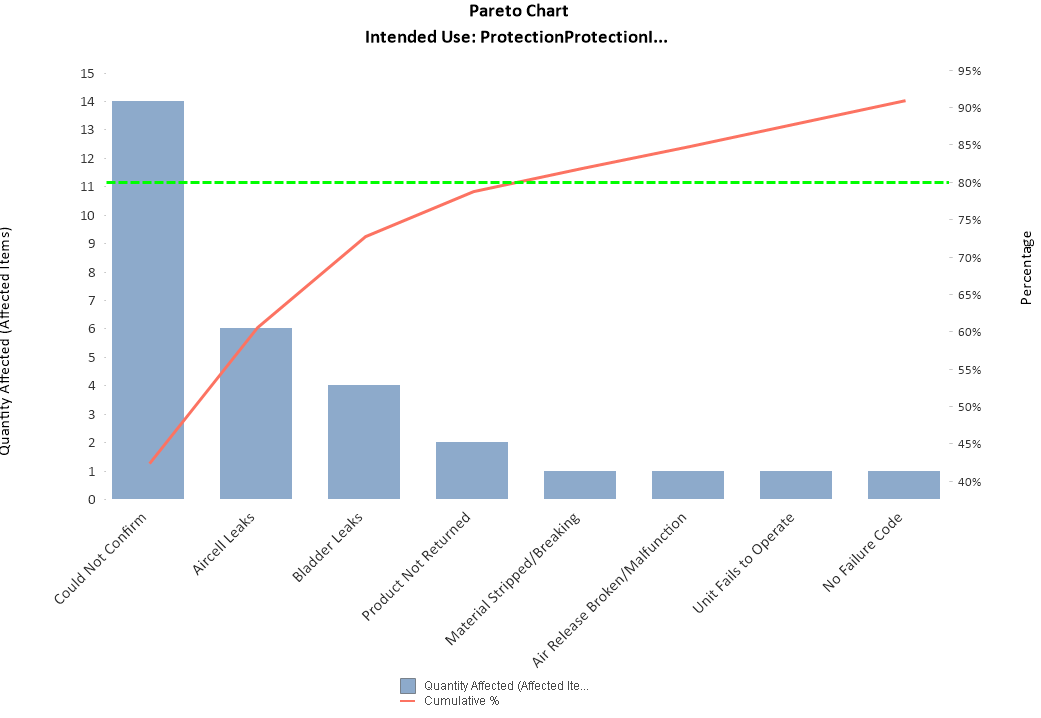
I have a pareto chart in my application (see attached). Some of the dimension values are Null. When I suppress NUll values I don't see the 100% on the Cumulative Line chart. But I show Null values then I can see the cumulative % values until 100%. How do I show 20 - 100% all values and not count Null dimension values for the chart?

 sreelathamohan
- Mark as New
- Bookmark
- Subscribe
- Mute
- Subscribe to RSS Feed
- Permalink
- Report Inappropriate Content
Actually that was a problem with my other expression. So now I see correct values for the bars.
But I still don't see a 100% on the cumulative line against the last bar. It is a 100.85%.

 sunny_talwar
- Mark as New
- Bookmark
- Subscribe
- Mute
- Subscribe to RSS Feed
- Permalink
- Report Inappropriate Content
The questions you are asking are difficult to answer without looking at a sample.. would you be able to share a sample where I can see this?
sunny_talwar
- Mark as New
- Bookmark
- Subscribe
- Mute
- Subscribe to RSS Feed
- Permalink
- Report Inappropriate Content
Not entirely sure, but try this may be
RangeSum(Above(Sum({<[Failure Detail] *= {"*"}>} [Quantity Affected]), 0, RowNo())) / Sum(TOTAL {<[Failure Detail] *= {"*"}>}[Quantity Affected])- Mark as New
- Bookmark
- Subscribe
- Mute
- Subscribe to RSS Feed
- Permalink
- Report Inappropriate Content
That did not work.
sunny_talwar
- Mark as New
- Bookmark
- Subscribe
- Mute
- Subscribe to RSS Feed
- Permalink
- Report Inappropriate Content
I can check if you are able to attach a sample
sreelathamohan
- Mark as New
- Bookmark
- Subscribe
- Mute
- Subscribe to RSS Feed
- Permalink
- Report Inappropriate Content
I don't think I will be able to attach the entire application. If I send you a sample excel with the dimension and measure values will you be able to tell?
sreelathamohan
- Mark as New
- Bookmark
- Subscribe
- Mute
- Subscribe to RSS Feed
- Permalink
- Report Inappropriate Content
I think something is wrong with the cumulative % expression. Please take a look at the excel file. Columns A, B, C are from the chart and D and E manually calculated.
If you look at the first row you will see that there is a discrepancy between values in values in col C and col E.
sreelathamohan
- Mark as New
- Bookmark
- Subscribe
- Mute
- Subscribe to RSS Feed
- Permalink
- Report Inappropriate Content
Here is the file.
sreelathamohan
- Mark as New
- Bookmark
- Subscribe
- Mute
- Subscribe to RSS Feed
- Permalink
- Report Inappropriate Content
I am actually trying to accomplish what's on the attached file. Show cumulative % until 80% and the rest as "Others" and a spike from 80% to 100%. Any help is appreciated.
 sunny_talwar
- Mark as New
- Bookmark
- Subscribe
- Mute
- Subscribe to RSS Feed
- Permalink
- Report Inappropriate Content
What is this giving you as an expression in a text object? Does it give you 133 or not?
Sum(TOTAL {<[Failure Detail] *= {"*"}>}[Quantity Affected])
