Unlock a world of possibilities! Login now and discover the exclusive benefits awaiting you.
Announcements
ALERT: QlikView server communication interruptions following Microsoft Windows Domain Controller security updates
- Qlik Community
- :
- All Forums
- :
- QlikView
- :
- Partial sum in pivot table
Options
- Subscribe to RSS Feed
- Mark Topic as New
- Mark Topic as Read
- Float this Topic for Current User
- Bookmark
- Subscribe
- Mute
- Printer Friendly Page
Turn on suggestions
Auto-suggest helps you quickly narrow down your search results by suggesting possible matches as you type.
Showing results for
Partner - Contributor III
2012-03-28
12:21 PM
- Mark as New
- Bookmark
- Subscribe
- Mute
- Subscribe to RSS Feed
- Permalink
- Report Inappropriate Content
Partial sum in pivot table
Hi All,
My pivot table is:
| 1 | |||
| 1.1 | |||
| 1.1.1 | 50 € | ||
| 1.1.2 | 100 € | ||
| 1.2. | |||
| 1.2.1 | -40 € | ||
| OK | TOTAL | 110 € | |
| 2 | |||
| 2.1 | |||
| 2.1.1 | -15 € | ||
| How do you do? | TOTAL | 95 € (NO -15 €) | |
| 3 | |||
| 3.1 | |||
| 3.1.1 | -10 € | ||
| 3.1.2 | 30 € | ||
| How do you do? | TOAL | 115 € (NO 20 €) | |
| TOTAL | 115 € |
Thanks!!!
1,091 Views
4 Replies
Not applicable
2012-03-28
01:03 PM
- Mark as New
- Bookmark
- Subscribe
- Mute
- Subscribe to RSS Feed
- Permalink
- Report Inappropriate Content
Try
if(Match(Dimensionality(),'0','1',), Rangesum(above(sum(Value)),0,rowno(total)),sum(Value))
625 Views
Partner - Contributor III
2012-03-29
04:14 AM
Author
- Mark as New
- Bookmark
- Subscribe
- Mute
- Subscribe to RSS Feed
- Permalink
- Report Inappropriate Content
Thanks marcsliving,
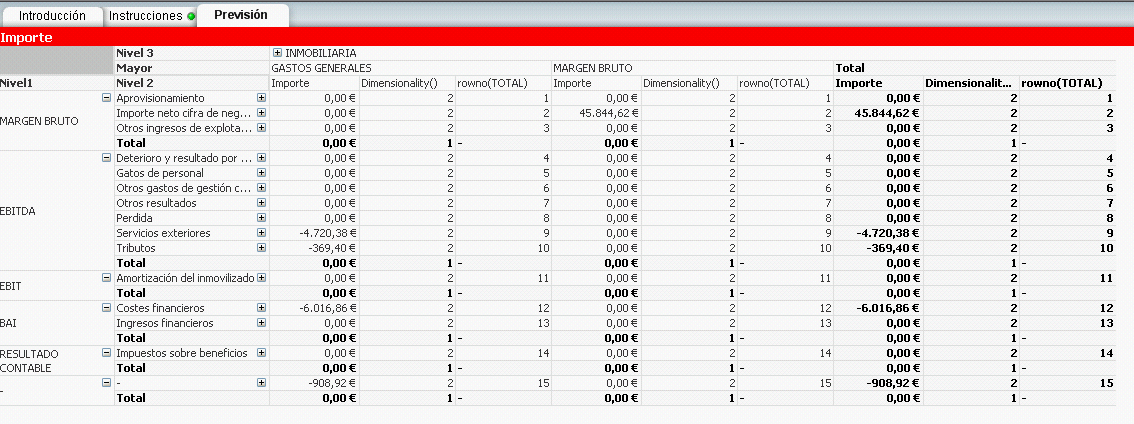
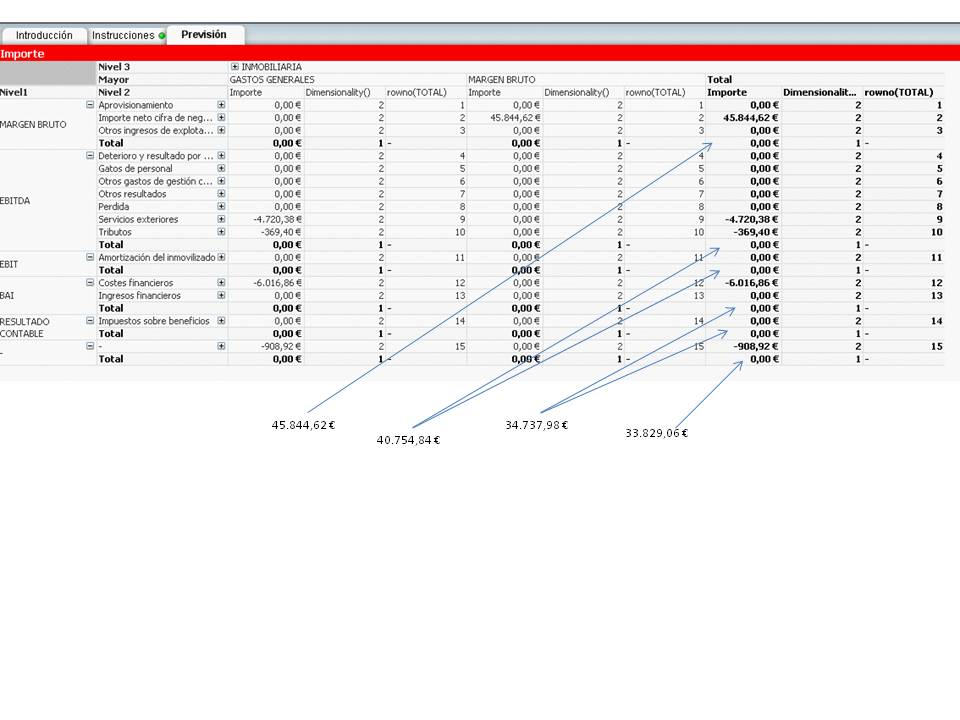
You can see that the formula does not work, I think it is rowno(TOTAL) is '-'.
625 Views
Specialist II
2012-03-29
05:34 AM
- Mark as New
- Bookmark
- Subscribe
- Mute
- Subscribe to RSS Feed
- Permalink
- Report Inappropriate Content
What you want to show
625 Views
Partner - Contributor III
2012-03-29
05:43 AM
Author
- Mark as New
- Bookmark
- Subscribe
- Mute
- Subscribe to RSS Feed
- Permalink
- Report Inappropriate Content
I attached a image
thanks!
625 Views