Unlock a world of possibilities! Login now and discover the exclusive benefits awaiting you.

- Qlik Community
- :
- All Forums
- :
- QlikView
- :
- Partially stacked chart
- Subscribe to RSS Feed
- Mark Topic as New
- Mark Topic as Read
- Float this Topic for Current User
- Bookmark
- Subscribe
- Mute
- Printer Friendly Page

 joseluis_garcia
- Mark as New
- Bookmark
- Subscribe
- Mute
- Subscribe to RSS Feed
- Permalink
- Report Inappropriate Content
Partially stacked chart
Hi
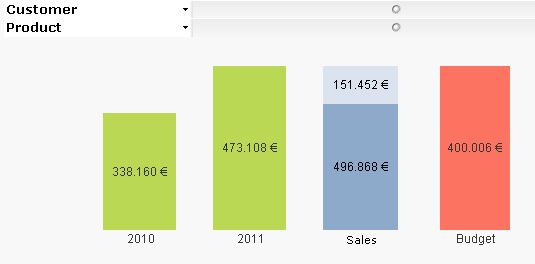
I am unable to solve a business graph. I have three measures (Amount, AmountPendingInvoice and Budget).The sales department has asked me a bar chart with 4 columns: prior to last year, the last year, current year + pending and budget similar to the picture below. This design is it possible with QV11?
I get with three different graphics. The problem is that the values in each chart are not on the same scale
Accepted Solutions
joseluis_garcia
- Mark as New
- Bookmark
- Subscribe
- Mute
- Subscribe to RSS Feed
- Permalink
- Report Inappropriate Content
Solved.
I created a dimension using Valuelist:
Measure = ValueList('LY2','LY','Sales','Budget','Forecast')
I created sis expressions using pick:
LY = pick(match(ValueList('LY2','LY','Sales','Budget','Forecast'),'LY2','LY','Sales','Budget','Forecast'),
// Year - 2
Sum({<Year={$(=Max(Year)-2)}>} Amount),
// Year - 1
Sum({<Year={$(=Max(Year)-1)}>} Amount),
// Sales
Null(),
// Budget
Null(),
// Forecast
Null()
)
Sales=
pick(match(ValueList('LY2','LY','Sales','Budget','Forecast'),'LY2','LY','Sales','Budget','Forecast'),
// Year - 2
Null(),
// Year - 1
Null(),
// Sales
Sum({<Year={$(=Max(Year))}>} Amount),
// Budget
Null(),
// Forecast
Null()
)
etc...
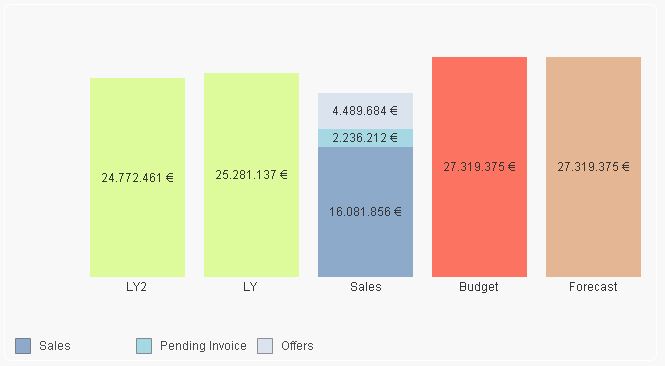
The resulting chart is this:
Thank you both

 MayilVahanan
- Mark as New
- Bookmark
- Subscribe
- Mute
- Subscribe to RSS Feed
- Permalink
- Report Inappropriate Content
Hi
Try valuelist function..
hope it helps.
Please close the thread by marking correct answer & give likes if you like the post.

 whiteline
- Mark as New
- Bookmark
- Subscribe
- Mute
- Subscribe to RSS Feed
- Permalink
- Report Inappropriate Content
Hi.
Imagine another dimension for that measure is 151,452 for sales and null() for others.
joseluis_garcia
- Mark as New
- Bookmark
- Subscribe
- Mute
- Subscribe to RSS Feed
- Permalink
- Report Inappropriate Content
Solved.
I created a dimension using Valuelist:
Measure = ValueList('LY2','LY','Sales','Budget','Forecast')
I created sis expressions using pick:
LY = pick(match(ValueList('LY2','LY','Sales','Budget','Forecast'),'LY2','LY','Sales','Budget','Forecast'),
// Year - 2
Sum({<Year={$(=Max(Year)-2)}>} Amount),
// Year - 1
Sum({<Year={$(=Max(Year)-1)}>} Amount),
// Sales
Null(),
// Budget
Null(),
// Forecast
Null()
)
Sales=
pick(match(ValueList('LY2','LY','Sales','Budget','Forecast'),'LY2','LY','Sales','Budget','Forecast'),
// Year - 2
Null(),
// Year - 1
Null(),
// Sales
Sum({<Year={$(=Max(Year))}>} Amount),
// Budget
Null(),
// Forecast
Null()
)
etc...
The resulting chart is this:
Thank you both
