Unlock a world of possibilities! Login now and discover the exclusive benefits awaiting you.
- Qlik Community
- :
- All Forums
- :
- QlikView
- :
- Percentage difference in a combo chart
- Subscribe to RSS Feed
- Mark Topic as New
- Mark Topic as Read
- Float this Topic for Current User
- Bookmark
- Subscribe
- Mute
- Printer Friendly Page
- Mark as New
- Bookmark
- Subscribe
- Mute
- Subscribe to RSS Feed
- Permalink
- Report Inappropriate Content
Percentage difference in a combo chart
Hello Experts,
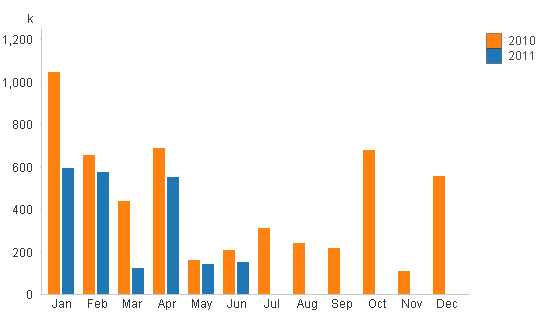
I have a como chart that shows values by month for 2 years. Please see the attached picture of this chart. I want to calculate the percentage difference b/w months and show this this diffence using a line. So, the first percentage would come from Jan2010 and Jan2011, then Feb2010 and Feb2011 so on and so forth.
Can anyone please help me how to calculate this percentage difference?
Many thanks.
- Mark as New
- Bookmark
- Subscribe
- Mute
- Subscribe to RSS Feed
- Permalink
- Report Inappropriate Content
Well, if you have two expressions for 2010 and 2011 with those labels, I think it could be like
= [2011] / [2010]
or using the appropriate expressions:
= sum( ...) / sum(...)
This will return the result for 2011 as percentage of 2010's result.
Hope I got your question correctly,
Stefan
P.S:
Or if you are interested in the variance, you could use
= (1-[2011]/[2010])
Set format in number to numerical and check %, don't forget to use a second axis (right) for the line graph.
edited by swuehl
- Mark as New
- Bookmark
- Subscribe
- Mute
- Subscribe to RSS Feed
- Permalink
- Report Inappropriate Content
Hi, To do this oi would have a single dimension ie Month then have three expressions, the last being on the righthand axis, these being:
=sum({<Year = {$(=max(Year)-1)}>} Sales)
=sum({<Year = {$(=max(Year))}>} Sales)
=sum({<Year = {$(=max(Year))}>} Sales)/sum({<Year = {$(=max(Year)-1)}>} Sales)
these would then be previous year, current year and % increase. respectively. I have attached an example QVW.
Thanks
Steve
- Mark as New
- Bookmark
- Subscribe
- Mute
- Subscribe to RSS Feed
- Permalink
- Report Inappropriate Content
Hi.
I have been struggling to find a solution to my question. The above is the closest type of solution I can find but does not answer it 100%.
Is there a way to calculate the % difference between any 2 different bar graph values. (IE: If I have as the above picture would suggest, say sales values per month for one single year I want to calculate the % difference between say Feb and March, March and April, etc... and display this as another series in the graph or on another graph)?
I need this to calculate dynamically instead of defining and manipulating fields in the edit script. (IE: if the user selected Feb and April (not March), the graph would have to calculate the % difference based on these two months.)
Please help...Thanks you