Unlock a world of possibilities! Login now and discover the exclusive benefits awaiting you.

- Qlik Community
- :
- All Forums
- :
- QlikView
- :
- Re: Pie Chart Dimension Label
- Subscribe to RSS Feed
- Mark Topic as New
- Mark Topic as Read
- Float this Topic for Current User
- Bookmark
- Subscribe
- Mute
- Printer Friendly Page

- Mark as New
- Bookmark
- Subscribe
- Mute
- Subscribe to RSS Feed
- Permalink
- Report Inappropriate Content
Pie Chart Dimension Label
Greetings Experts and Masters,
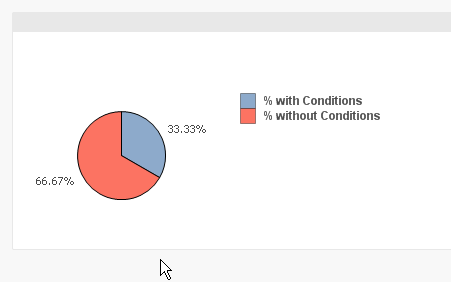
I have a pie chart with a dimension with two values. See example picture file. I have actually created two pie charts. One that gives a percentage of members in each group and the other give the percentage of dollars spent on each group.
I would like to change the dimension legend labels.
Currently they are CDM Lives and Non CDM Lives
I would like them to be
% with Conditions
% without Conditions
On second chart
% spent with Conditions
% spent without Conditions
I know I could very inefficiently go into the load script and just create some new fields in the table with these new dimension names.
I am hoping for a savvy way of editing legend labels
I also tried creating a calculated dimension, but it shows the formula in the legend rather than the desired labels.
Hope someone has the answer.

Accepted Solutions
- Mark as New
- Bookmark
- Subscribe
- Mute
- Subscribe to RSS Feed
- Permalink
- Report Inappropriate Content
Calculated dimension should work fine, but don't forget to <untick> Label for the Calculated Dimension, otherwise the expression will show as the Label.
- Mark as New
- Bookmark
- Subscribe
- Mute
- Subscribe to RSS Feed
- Permalink
- Report Inappropriate Content
Calculated dimension should work fine, but don't forget to <untick> Label for the Calculated Dimension, otherwise the expression will show as the Label.
- Mark as New
- Bookmark
- Subscribe
- Mute
- Subscribe to RSS Feed
- Permalink
- Report Inappropriate Content
Hi Bill,
Yes, you are correct. I just needed to uncheck the label box and it work. Thanks for your quick response.
Mike

 maxgro
- Mark as New
- Bookmark
- Subscribe
- Mute
- Subscribe to RSS Feed
- Permalink
- Report Inappropriate Content
maybe this dimension
=if(Dim='CDM Lives',
dual('% with Conditions', Dim),
dual('% without Conditions', Dim)
)