Unlock a world of possibilities! Login now and discover the exclusive benefits awaiting you.

- Qlik Community
- :
- All Forums
- :
- QlikView
- :
- Pie Chart
- Subscribe to RSS Feed
- Mark Topic as New
- Mark Topic as Read
- Float this Topic for Current User
- Bookmark
- Subscribe
- Mute
- Printer Friendly Page

 evansabres
- Mark as New
- Bookmark
- Subscribe
- Mute
- Subscribe to RSS Feed
- Permalink
- Report Inappropriate Content
Pie Chart
Hello -
I would like to create a pie chart to show sales by different product type.
My dimension is [Major Group] under which there are items such as Food, Beer, Wine, Liquor.
I want to create a pie chart that gives the percentage of overall sales (That dimension is called [Sales Total]
As the different items are not named in the script, what is the best way to do this?
Thank you.
Accepted Solutions

 sunny_talwar
- Mark as New
- Bookmark
- Subscribe
- Mute
- Subscribe to RSS Feed
- Permalink
- Report Inappropriate Content
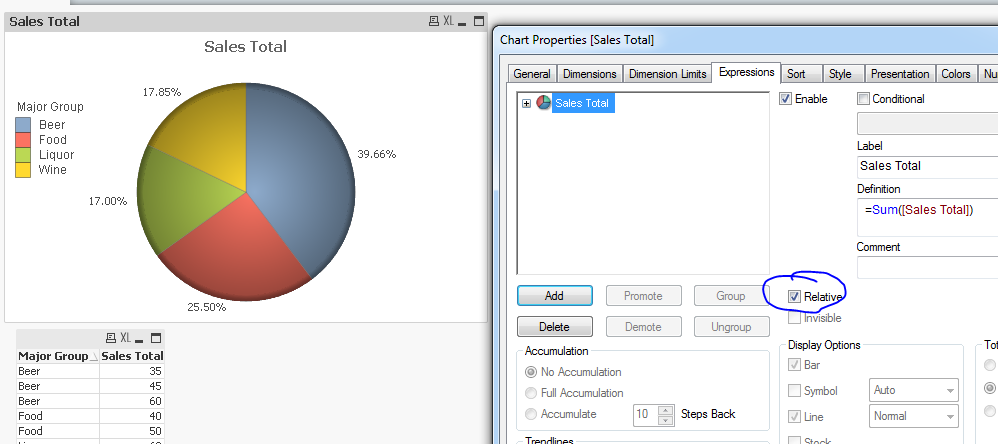
I think if you add [Major Group] as dimension and Sum([Sales Total]) as expression and select relative, you should get what you are looking for.
sunny_talwar
- Mark as New
- Bookmark
- Subscribe
- Mute
- Subscribe to RSS Feed
- Permalink
- Report Inappropriate Content
I think if you add [Major Group] as dimension and Sum([Sales Total]) as expression and select relative, you should get what you are looking for.
