Unlock a world of possibilities! Login now and discover the exclusive benefits awaiting you.

- Qlik Community
- :
- All Forums
- :
- QlikView
- :
- Re: Pie chart question
- Subscribe to RSS Feed
- Mark Topic as New
- Mark Topic as Read
- Float this Topic for Current User
- Bookmark
- Subscribe
- Mute
- Printer Friendly Page

- Mark as New
- Bookmark
- Subscribe
- Mute
- Subscribe to RSS Feed
- Permalink
- Report Inappropriate Content
Pie chart question
I have a value for computer warranty expiration dates and with a value like that all the dates are different. However in the pie chart I would like it to breakdown the warranty expiration for the years. So it will display a value for x number in 2015 and x number in 2016. Then if you choose to click on a slice of the pie in the table box it shows all the machines that are due in that year. Possible? Thanks!
- Tags:
- new_to_qlikview

Accepted Solutions

 Nicole-Smith
- Mark as New
- Bookmark
- Subscribe
- Mute
- Subscribe to RSS Feed
- Permalink
- Report Inappropriate Content
First Dimension: year(yearstart(YourDateField))
Condition: GetSelectedCount(YourDateField)=0
Second Dimension: YourDateField
Condition: GetSelectedCount(YourDateField)>0
Nicole-Smith
- Mark as New
- Bookmark
- Subscribe
- Mute
- Subscribe to RSS Feed
- Permalink
- Report Inappropriate Content
First Dimension: year(yearstart(YourDateField))
Condition: GetSelectedCount(YourDateField)=0
Second Dimension: YourDateField
Condition: GetSelectedCount(YourDateField)>0
- Mark as New
- Bookmark
- Subscribe
- Mute
- Subscribe to RSS Feed
- Permalink
- Report Inappropriate Content
You can try the concept of creating groups which on click of slice shows the sub-dimension values.
Thanks,
Sai
- Mark as New
- Bookmark
- Subscribe
- Mute
- Subscribe to RSS Feed
- Permalink
- Report Inappropriate Content
Thanks!
- Mark as New
- Bookmark
- Subscribe
- Mute
- Subscribe to RSS Feed
- Permalink
- Report Inappropriate Content
I got the items in but I don't think it is calculating correctly because when I pull the same data into a pivot table my counts are different. Is this what should be seen? 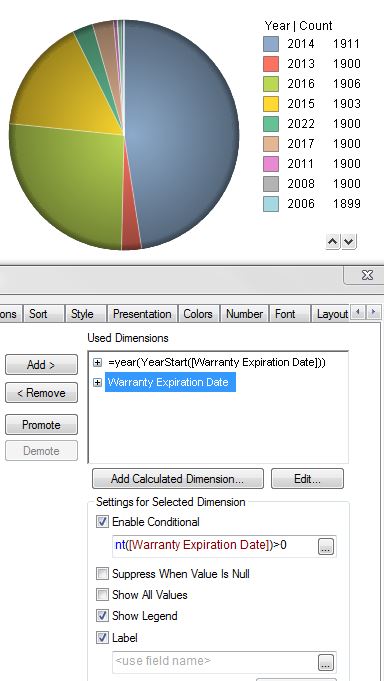
Nicole-Smith
- Mark as New
- Bookmark
- Subscribe
- Mute
- Subscribe to RSS Feed
- Permalink
- Report Inappropriate Content
Looks right to me. As long as you're using the same dimensions and expression in the pivot table, I don't see why they would be any different.