Unlock a world of possibilities! Login now and discover the exclusive benefits awaiting you.

- Qlik Community
- :
- All Forums
- :
- QlikView
- :
- Re: Pivot table Totals
- Subscribe to RSS Feed
- Mark Topic as New
- Mark Topic as Read
- Float this Topic for Current User
- Bookmark
- Subscribe
- Mute
- Printer Friendly Page

 EGilbert
- Mark as New
- Bookmark
- Subscribe
- Mute
- Subscribe to RSS Feed
- Permalink
- Report Inappropriate Content
Pivot table Totals
I have a question about Pivot tables. I am doing an analysis by region for some plants and I have a number of different capacities in my file. i need to select the lowest capacity listed for each plant. I then need to sum those capacities to get a total capacity by year. i have built the pivot table below and i get the mins fine but when it sums it follows the expression and shows the min value, rather than adding them together
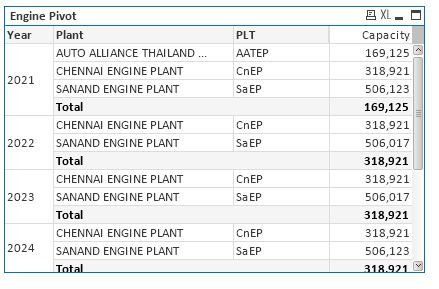
How can I add the calculated mins together. The expression I used for the mins is :
min({$<[Capacity Type E]={"Installed"}>}[Harbour Capacity])
I tried dimension() but could not get the totals to work as it just keeps adding all the other values not shown as well.
Accepted Solutions
EGilbert
- Mark as New
- Bookmark
- Subscribe
- Mute
- Subscribe to RSS Feed
- Permalink
- Report Inappropriate Content
I was able to get the solution to work with the use of Dimensionality. Thanks all who replied

 petter
- Mark as New
- Bookmark
- Subscribe
- Mute
- Subscribe to RSS Feed
- Permalink
- Report Inappropriate Content
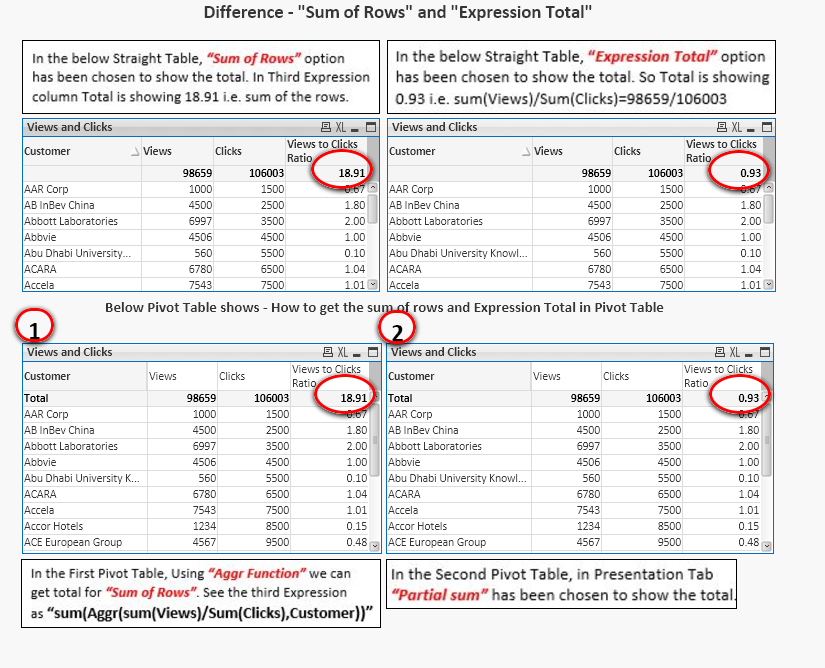
Have a look at this post which explains the solution to address you problem very well:
There is an attached QlikView application within the article as well.
Here is a screenshot of the main sheet:
 EGilbert
- Mark as New
- Bookmark
- Subscribe
- Mute
- Subscribe to RSS Feed
- Permalink
- Report Inappropriate Content
Thanks for the reply
EGilbert
- Mark as New
- Bookmark
- Subscribe
- Mute
- Subscribe to RSS Feed
- Permalink
- Report Inappropriate Content
I was able to get the solution to work with the use of Dimensionality. Thanks all who replied
