Unlock a world of possibilities! Login now and discover the exclusive benefits awaiting you.

- Qlik Community
- :
- All Forums
- :
- QlikView
- :
- Re: Pivot table with aggregated columns
- Subscribe to RSS Feed
- Mark Topic as New
- Mark Topic as Read
- Float this Topic for Current User
- Bookmark
- Subscribe
- Mute
- Printer Friendly Page

- Mark as New
- Bookmark
- Subscribe
- Mute
- Subscribe to RSS Feed
- Permalink
- Report Inappropriate Content
Pivot table with aggregated columns
Hi
I want to create a Pivot Table where I will show Items sold and profit per year (row). In addition, I want to show a third metric column with the aggregated profit from first row until each row. For example, forth row (2014) will be the sum profit of 2011 + 2012 + 2013 + 2014.
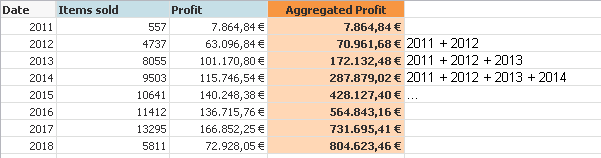
I'm trying to get it with Set Analisis, AGGR and TOTAL functions, without success. Please, anyone knows how can I get it?
Thanks in advance
Cheers
- Tags:
- pivot table
Accepted Solutions

 sunny_talwar
- Mark as New
- Bookmark
- Subscribe
- Mute
- Subscribe to RSS Feed
- Permalink
- Report Inappropriate Content
sunny_talwar
- Mark as New
- Bookmark
- Subscribe
- Mute
- Subscribe to RSS Feed
- Permalink
- Report Inappropriate Content
May be try this
RangeSum(Above(Sum(Profit), 0, RowNo()))
 marcus_sommer
- Mark as New
- Bookmark
- Subscribe
- Mute
- Subscribe to RSS Feed
- Permalink
- Report Inappropriate Content
You need interrecord-functions for this tasks, for example:
rangesum(above(sum(Profit), 0, rowno(total)))
- Marcus
- Mark as New
- Bookmark
- Subscribe
- Mute
- Subscribe to RSS Feed
- Permalink
- Report Inappropriate Content
Thanks!!, it works but the partial sum (default row with total) is not calculated, is it normal?
- Mark as New
- Bookmark
- Subscribe
- Mute
- Subscribe to RSS Feed
- Permalink
- Report Inappropriate Content
Thanks Marcus! 
sunny_talwar
- Mark as New
- Bookmark
- Subscribe
- Mute
- Subscribe to RSS Feed
- Permalink
- Report Inappropriate Content
You might be able to use Dimensionality() function to calculate a partial sum... but I am not sure what the partial sum needs to look like for accumulated value?
- Mark as New
- Bookmark
- Subscribe
- Mute
- Subscribe to RSS Feed
- Permalink
- Report Inappropriate Content
Thanks, I will check it