Unlock a world of possibilities! Login now and discover the exclusive benefits awaiting you.
- Qlik Community
- :
- All Forums
- :
- QlikView
- :
- Re: Prior Month Financial Dollar KPI
- Subscribe to RSS Feed
- Mark Topic as New
- Mark Topic as Read
- Float this Topic for Current User
- Bookmark
- Subscribe
- Mute
- Printer Friendly Page
- Mark as New
- Bookmark
- Subscribe
- Mute
- Subscribe to RSS Feed
- Permalink
- Report Inappropriate Content
Prior Month Financial Dollar KPI
Hello,
I am trying to create a KPI for showing the difference between the current month $ finances and the previous month $ finances.
The formula I have below does not work: Any advice would be much appreciated:
=Sum({<DischargeDTS = {">=$(=monthstart(addmonths(Max(DischargeDTS),-2)))<=$(=Monthend(addmonths(Max(DischargeDTS),-2)))"}{[Financial Impact])
In terms of displaying the KPI I found this link helpful:
Creating a KPI object in QlikView
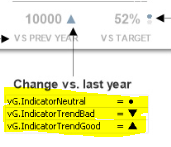
However, I cannot figure out how the indicators are added:
Thanks,
Erin
Accepted Solutions
- Mark as New
- Bookmark
- Subscribe
- Mute
- Subscribe to RSS Feed
- Permalink
- Report Inappropriate Content
Ty with :
=Sum({<DischargeDTS = {">=$(=monthstart(addmonths(Max(DischargeDTS),-2)))<=$(=Monthend(addmonths(Max(DischargeDTS),-2)))"}>} [Financial Impact])
And about displaying narrow in your expression, you have two ways :
-Use symbol directly in your expression e.g : if(Your_field < 0,'▼'), and use backgroud color for change color if (Your_field>0,red())
-Use image stored on the server : if(Your_field<0, Path/SO_arrow_red, NE_arrow_green)