Unlock a world of possibilities! Login now and discover the exclusive benefits awaiting you.

- Qlik Community
- :
- All Forums
- :
- QlikView
- :
- Problem with Rank Function, Column Order
- Subscribe to RSS Feed
- Mark Topic as New
- Mark Topic as Read
- Float this Topic for Current User
- Bookmark
- Subscribe
- Mute
- Printer Friendly Page

- Mark as New
- Bookmark
- Subscribe
- Mute
- Subscribe to RSS Feed
- Permalink
- Report Inappropriate Content
Problem with Rank Function, Column Order
Please see attached. The Rank() function returns the data I want to see as long as it's in the second (or greater) column position in the chart. If I move it to the first column position, it fixes the sort order in an undesirable fashion and I can't restore it. (Specifically it shows 10 through 1 in descending order when re-sorted, but not 1 through 10 as desired.)
The attachment uses the QlikView provided sample sales data.
Thanks.
BONUS QUESTION: How can I get the Total to show the total of only the values shown (Top 10 versus the whole set)?
Accepted Solutions

 maxgro
- Mark as New
- Bookmark
- Subscribe
- Mute
- Subscribe to RSS Feed
- Permalink
- Report Inappropriate Content
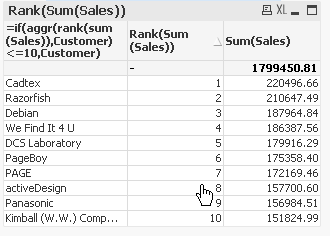
Remove the dimension limit
Replace the dimension Customer with
=if(aggr(rank(sum(Sales)),Customer)<=10,Customer)

 trdandamudi
- Mark as New
- Bookmark
- Subscribe
- Mute
- Subscribe to RSS Feed
- Permalink
- Report Inappropriate Content
Please see the attached file and hope this resolves your issue...
 MK_QSL
- Mark as New
- Bookmark
- Subscribe
- Mute
- Subscribe to RSS Feed
- Permalink
- Report Inappropriate Content
Use this for Rank
=Num(Rank(Total Sum(Sales),4))
For Total Sales u can use
SUM(Total Sales)
SUM(Sales)/SUM(TOTAL Sales) will give you % to Total Sales for each Customer.
maxgro
- Mark as New
- Bookmark
- Subscribe
- Mute
- Subscribe to RSS Feed
- Permalink
- Report Inappropriate Content
Remove the dimension limit
Replace the dimension Customer with
=if(aggr(rank(sum(Sales)),Customer)<=10,Customer)
- Mark as New
- Bookmark
- Subscribe
- Mute
- Subscribe to RSS Feed
- Permalink
- Report Inappropriate Content
Thanks. That seems to work except re-sorting the sales eventually brings up sales from the bottom. The total as Sum of Rows works better.
- Mark as New
- Bookmark
- Subscribe
- Mute
- Subscribe to RSS Feed
- Permalink
- Report Inappropriate Content
Thank you. Initially gives good values, but re-sorting doesn't work very well.
- Mark as New
- Bookmark
- Subscribe
- Mute
- Subscribe to RSS Feed
- Permalink
- Report Inappropriate Content
This works best and re-sorting works as expected. The NULL value even works as a rollup of "Others" but is easily suppressed. Thank you!