Unlock a world of possibilities! Login now and discover the exclusive benefits awaiting you.

- Qlik Community
- :
- All Forums
- :
- QlikView
- :
- Re: Qlikview chart problem
- Subscribe to RSS Feed
- Mark Topic as New
- Mark Topic as Read
- Float this Topic for Current User
- Bookmark
- Subscribe
- Mute
- Printer Friendly Page

 sayanpwc
- Mark as New
- Bookmark
- Subscribe
- Mute
- Subscribe to RSS Feed
- Permalink
- Report Inappropriate Content
Qlikview chart problem
Hello friends,
Need a help. Supose I have a dataset with vendorname and spend.
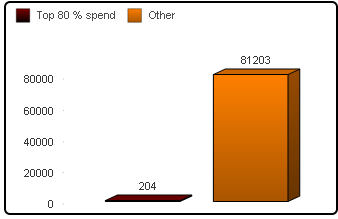
I want a bar chart that will depict 80 % sales comes from how many no of vendors i,e count of vendors and rest coming from how many vendors.
like in the pic. top 80 % spend comes from 204 vendors and rest from 81203.
How to do that?
Please help.

 sunny_talwar
- Mark as New
- Bookmark
- Subscribe
- Mute
- Subscribe to RSS Feed
- Permalink
- Report Inappropriate Content
Check here
sayanpwc
- Mark as New
- Bookmark
- Subscribe
- Mute
- Subscribe to RSS Feed
- Permalink
- Report Inappropriate Content
But sorted aggregation works on Qlikview 12 onwards. I need it to work in qlikview 11. how to do this?
sunny_talwar
- Mark as New
- Bookmark
- Subscribe
- Mute
- Subscribe to RSS Feed
- Permalink
- Report Inappropriate Content
It would be extremely difficult, if not impossible to do this.... look at this thread which started as a QV11 thread... but then the response market as correct was a QV12 based response... but you can look at ideas for how to do it in QV11 by reading through the thread
