Unlock a world of possibilities! Login now and discover the exclusive benefits awaiting you.
- Qlik Community
- :
- All Forums
- :
- QlikView
- :
- Re: ROLLING 16 Months Growth
- Subscribe to RSS Feed
- Mark Topic as New
- Mark Topic as Read
- Float this Topic for Current User
- Bookmark
- Subscribe
- Mute
- Printer Friendly Page
- Mark as New
- Bookmark
- Subscribe
- Mute
- Subscribe to RSS Feed
- Permalink
- Report Inappropriate Content
ROLLING 16 Months Growth
Hi
I want to represent Last 16 Month Rolling Growth%.
I have Sales of Products for 3 Years.
Growth will be calculated as
for Eg. Oct 2013 Growth= (Oct 2013 Sales - Oct 2012 Sales)/Oct 2012 Sales.
I have to use Month Year as Dimension.
Thanks and Regards
- « Previous Replies
- Next Replies »
- Mark as New
- Bookmark
- Subscribe
- Mute
- Subscribe to RSS Feed
- Permalink
- Report Inappropriate Content
Hi,
Please find attchment
Please appreciate our Qlik community members by giving Kudos for sharing their time for your query. If your query is answered, please mark the topic as resolved 🙂
- Mark as New
- Bookmark
- Subscribe
- Mute
- Subscribe to RSS Feed
- Permalink
- Report Inappropriate Content
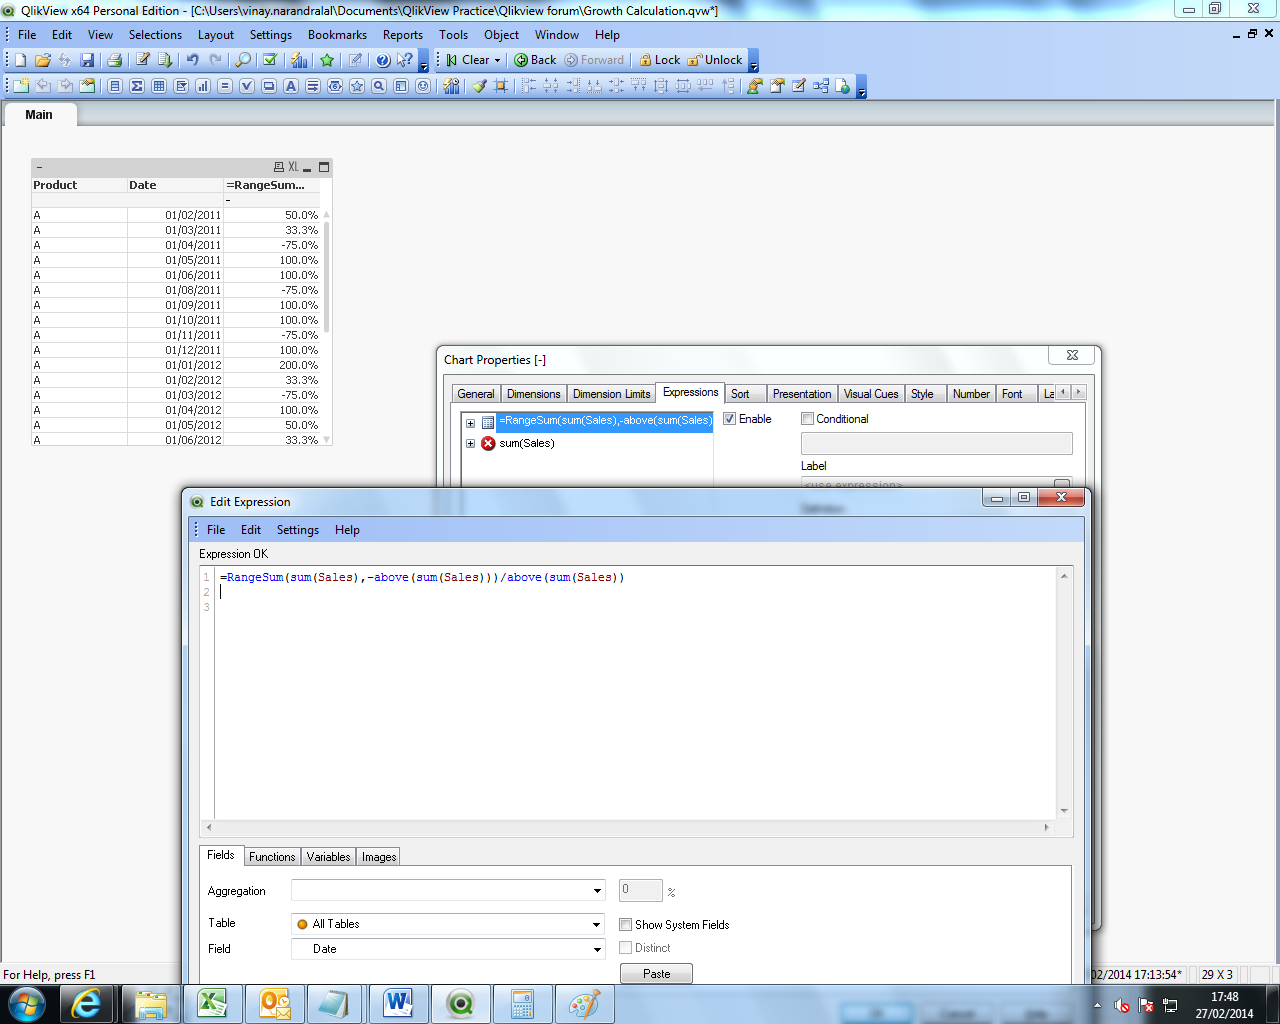
if you have straight table then use..
RangeSum(sum(Sales),-above(sum(Sales)))/above(sum(Sales))
- Mark as New
- Bookmark
- Subscribe
- Mute
- Subscribe to RSS Feed
- Permalink
- Report Inappropriate Content
Vinay this way i will able to calculate growth with respect to Last month.
But my requirement is not that.
Thanks
- Mark as New
- Bookmark
- Subscribe
- Mute
- Subscribe to RSS Feed
- Permalink
- Report Inappropriate Content
Assuming that you have YearMonth as dimension and that YearMonth is a date serial number (which it is in your Excel sheet), then you can calculate this month's number as
Sum(Sales)
and the number for the month 12 months ago as
Sum(Aggr(Rangesum(Above(Sum(Sales),12,1)),YearMonth))
So your expression becomes
Sum(Sales)/Sum(Aggr(Rangesum(Above(Sum(Sales),12,1)),YearMonth)) - 1
You need to make sure that your YearMonths are loaded in chronological order though, since the Aggr() function internally sorts according to load order.
You cannot use the $-expansion with a formula, since it is not sensitive for the dimensional scope.
HIC
- Mark as New
- Bookmark
- Subscribe
- Mute
- Subscribe to RSS Feed
- Permalink
- Report Inappropriate Content
Thanks alot Henric.
It works like charm.
I know only you can solve this problem.
You are a Champ.
- Mark as New
- Bookmark
- Subscribe
- Mute
- Subscribe to RSS Feed
- Permalink
- Report Inappropriate Content
It works fine when i have not selected anything.
At the moment I want to see growth of a Particular Month this will not work.
Any Solution for that?
- Mark as New
- Bookmark
- Subscribe
- Mute
- Subscribe to RSS Feed
- Permalink
- Report Inappropriate Content
You're right. A selection will disable the summation inside the Aggr. So you need to remove that selection by using Set Analysis inside the Aggr(). I believe the following will work:
Sum(Sales) / Sum(Aggr(Rangesum(Above( Sum({$<YearMonth=>} Sales),12,1)), YearMonth)) -1
HIC
- « Previous Replies
- Next Replies »