Unlock a world of possibilities! Login now and discover the exclusive benefits awaiting you.
- Qlik Community
- :
- All Forums
- :
- QlikView
- :
- Re: RangeSum Expression Alteration needed for char...
- Subscribe to RSS Feed
- Mark Topic as New
- Mark Topic as Read
- Float this Topic for Current User
- Bookmark
- Subscribe
- Mute
- Printer Friendly Page
- Mark as New
- Bookmark
- Subscribe
- Mute
- Subscribe to RSS Feed
- Permalink
- Report Inappropriate Content
RangeSum Expression Alteration needed for chart?
Hi all,
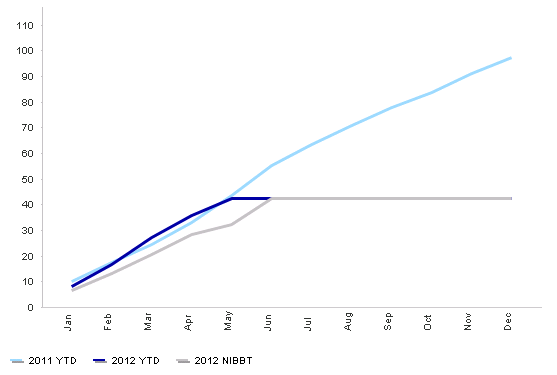
I have a chart in which I am trying to show YTD values by using the RangeSum expression. The chart has month on the x axis. I am showing 2011 and 2012 data on this.
The issue I have is that I only want to show my YTD values up to the current month. In my chart after July (the current month) I have a flat line whereas i do not want to show a line as there isn't actually any data? As you can see the blue and grey line go flat for 2012 after June as we dont have anymore data there. Is there a way to remove this? help would be greatly appreciated. Because we have data for all of 2011 the expression works fine.
My expressions are as follows:
2012 YTD:
rangesum(above(sum({<CalendarMonthAndYearMMMYY=, CalendarYear = {'2012'}>}[Revenue])/1000000, 0, rowno()))
Thanks
- Mark as New
- Bookmark
- Subscribe
- Mute
- Subscribe to RSS Feed
- Permalink
- Report Inappropriate Content
Does anyone have any ideas or know if this is possible? Getting stuck on this at present.
thanks alot
- Mark as New
- Bookmark
- Subscribe
- Mute
- Subscribe to RSS Feed
- Permalink
- Report Inappropriate Content
Does anyone have any ideas or know if this is possible? Getting stuck on this at present.
thanks alot
- Mark as New
- Bookmark
- Subscribe
- Mute
- Subscribe to RSS Feed
- Permalink
- Report Inappropriate Content
rangesum(above(sum({<CalendarMonthAndYearMMMYY={"<='Jun2012"}, CalendarYear = {'2012'}>}[Revenue])/1000000, 0, rowno()))
Obviously this is not exactly dynamic, however you are already hardcoding '2012'...
Hope this helps,
Jason
- Mark as New
- Bookmark
- Subscribe
- Mute
- Subscribe to RSS Feed
- Permalink
- Report Inappropriate Content
Thanks for the reply but it doesn't work unfortunately. I had a somewhat dynamic expression using vmaxdate which equated to the Calendarmonth chosen on my monthyear listbox.
RangeSum(Above(Sum({<CalendarMonthAndYearMMMYY={"<=$(vMaxDate)"},CalendarYear = {'2012'}>}[Total Income])/1000000, 0, RowNo()))
this however yields exactly the same results as previously. if i did not have the 2011 expression in my chart everything would work but it is this that is causing the issue asthe x-axis is month and not monthyear.
Not sure what other avenues to explore 😐
- Mark as New
- Bookmark
- Subscribe
- Mute
- Subscribe to RSS Feed
- Permalink
- Report Inappropriate Content
This should not be too difficult really. My previous answer was stupid as I had a <= on a non-numeric field ;-S
Can you post your app?
- Mark as New
- Bookmark
- Subscribe
- Mute
- Subscribe to RSS Feed
- Permalink
- Report Inappropriate Content
Hi jason,
Unfortunately due to company policy I cannot upload any files and only images:
For these charts I have 1 table which is connected to a master calendar table:
The table spans over 2010, 2011 and 2012, I only show 2011/2012 data which are both shown over a month field as per the graph illustration above.
however, my expression using my variable simply does not remove the horizontal line for my 2012 data, not sure what the issue is at all. I have a small screenshot of some sample data here.
Thanks