Unlock a world of possibilities! Login now and discover the exclusive benefits awaiting you.

- Qlik Community
- :
- All Forums
- :
- QlikView
- :
- Re: Set analysis range
- Subscribe to RSS Feed
- Mark Topic as New
- Mark Topic as Read
- Float this Topic for Current User
- Bookmark
- Subscribe
- Mute
- Printer Friendly Page

 chris_munns
- Mark as New
- Bookmark
- Subscribe
- Mute
- Subscribe to RSS Feed
- Permalink
- Report Inappropriate Content
Set analysis range
Struggling with the right syntax for a sum of units;
I need to sum the units from the start of the month and 59 days forward. Date variable in the chart/table looks like this;
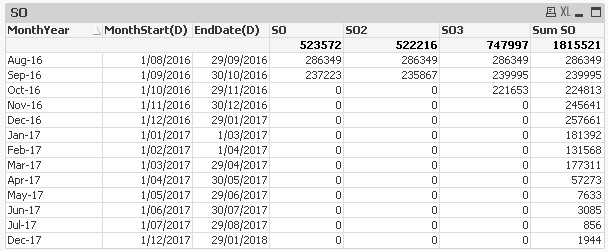
Expression SO3 is;
sum({1<Date= {">=$(=vMonthStartDate)<=$(='30/10/2016')"}> } [Units])
this seems to break up the calculated values by [MonthYear]. The result i need is a value for Sep-16 that is the sum of the [Units] between 1/9/2016 and 30/10/2016 - 461648 (239995+2211653) units displayed in place of the 239995 number.
Not quite sure where i am going wrong.
Thanks,
Chris
- « Previous Replies
-
- 1
- 2
- Next Replies »
chris_munns
- Mark as New
- Bookmark
- Subscribe
- Mute
- Subscribe to RSS Feed
- Permalink
- Report Inappropriate Content
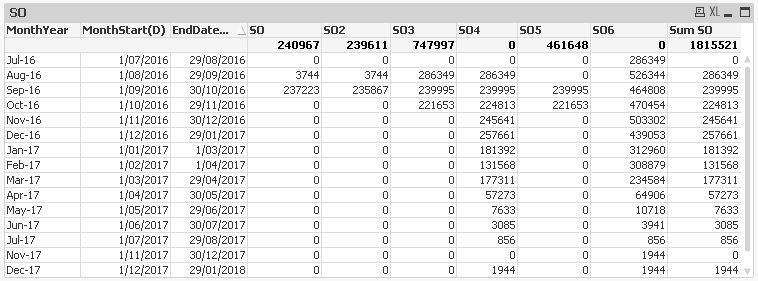
Thanks again;
SO6 (Sonny T) =RangeSum(Below(TOTAL Sum([Units]),0,2))

 sunny_talwar
- Mark as New
- Bookmark
- Subscribe
- Mute
- Subscribe to RSS Feed
- Permalink
- Report Inappropriate Content
Would you be able to share your qvw file? I see what the issue is, but will have to play around with it to get you the output you are looking for.
chris_munns
- Mark as New
- Bookmark
- Subscribe
- Mute
- Subscribe to RSS Feed
- Permalink
- Report Inappropriate Content
Hi Sunny,
Its tricky to share without some prep work on the file.
I am wondering if I create a new table with the Units summarised for [MonthStart] to ([MonthStart] +59).
This should give me 1 record per MonthYear.
Data granularity is;
- SKU
- Order#
- Date
- Warehouse
- Units
Ideally, then 1 record per SKU and Wahrehouse per MonthStart.
Thanks,
Chris

 othniel2014
- Mark as New
- Bookmark
- Subscribe
- Mute
- Subscribe to RSS Feed
- Permalink
- Report Inappropriate Content
Try this in the script you must add a field ---> Num(Date) as DateNum
Then use this in the graph.
Sum({1<
DateNum={$(='">= ' & $(=num($(=MonthStart(floor(Num(Date)))))) & ' <= ' & $(=num($(=MonthStart(floor(Num(Date))) + 59 ))) &'"')}
>} [Units])
chris_munns
- Mark as New
- Bookmark
- Subscribe
- Mute
- Subscribe to RSS Feed
- Permalink
- Report Inappropriate Content
Hi all,
Hopefully solved a different way by loading distinct MonthStart and EndDate (MonthStart+59).
Then outer join to the Sales orders transaction table creating ~2m records and stored this in a temp qvd then dropped. Next reloaded the temp qvd summarising Units there [Data] between [MonthStart] and [EndDate] then grouping by [MonthStart] , [EndDate]. Approx 62k records.
This second temp table I then concatenate to the link table with all the other data with the datekey on MonthStart.
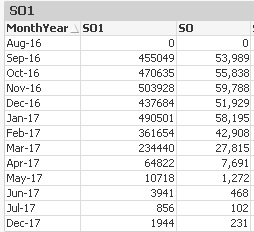
SO1 =sum(UnitsNew) - also these is criteria to ignore the current month, hence 0 in Aug-16.
SO is SO1 / 59 * 7 to calc a weekly 'disposal rate'
Next task is to align to 'Projected Stock' and calc how many weeks stock is on hand for each MonthYear.
Thanks,
Chris
chris_munns
- Mark as New
- Bookmark
- Subscribe
- Mute
- Subscribe to RSS Feed
- Permalink
- Report Inappropriate Content
Hi Othniel,
I did try this though i am not sure the syntax is quite right. See below;

I didn't get a chance to check further.
Thanks,
Chris
sunny_talwar
- Mark as New
- Bookmark
- Subscribe
- Mute
- Subscribe to RSS Feed
- Permalink
- Report Inappropriate Content
I think why don't you look into The As-Of Table. I think this is the best solution for your issue.

- « Previous Replies
-
- 1
- 2
- Next Replies »