Unlock a world of possibilities! Login now and discover the exclusive benefits awaiting you.
Announcements
Q&A with Qlik - Qlik Cloud Migration: Questions about migrating to Qlik Cloud? Catch the latest replay!
- Qlik Community
- :
- All Forums
- :
- QlikView
- :
- Shading in a bar chart having only 1 expression
Options
- Subscribe to RSS Feed
- Mark Topic as New
- Mark Topic as Read
- Float this Topic for Current User
- Bookmark
- Subscribe
- Mute
- Printer Friendly Page
Turn on suggestions
Auto-suggest helps you quickly narrow down your search results by suggesting possible matches as you type.
Showing results for
Anonymous
Not applicable
2017-10-02
04:17 PM
- Mark as New
- Bookmark
- Subscribe
- Mute
- Subscribe to RSS Feed
- Permalink
- Report Inappropriate Content
Shading in a bar chart having only 1 expression
Hi,
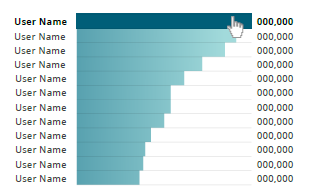
Users requested to create a bar chat which shows the document count based on user name.
It is one dimension, one expression bar chart.
As you see in the below graph, they wanted shading colored bars and when they hover over a bar the color has change/highlight.
Can someone please help me achieve this result? Thanks!
507 Views
2 Replies
Partner Ambassador/MVP
2017-10-02
04:29 PM
- Mark as New
- Bookmark
- Subscribe
- Mute
- Subscribe to RSS Feed
- Permalink
- Report Inappropriate Content
Hi,
Check colormix function.
Regards,
Kaushik Solanki
Please remember to hit the 'Like' button and for helpful answers and resolutions, click on the 'Accept As Solution' button. Cheers!
460 Views
Support
2017-10-02
04:33 PM
- Mark as New
- Bookmark
- Subscribe
- Mute
- Subscribe to RSS Feed
- Permalink
- Report Inappropriate Content
Shading you can achieve using Colormix() (there´s a wizard into your expression builder window)
Different color on mouse over is not possible using regular qlik object
460 Views