Unlock a world of possibilities! Login now and discover the exclusive benefits awaiting you.

- Qlik Community
- :
- All Forums
- :
- QlikView
- :
- Show Percentage on chart
- Subscribe to RSS Feed
- Mark Topic as New
- Mark Topic as Read
- Float this Topic for Current User
- Bookmark
- Subscribe
- Mute
- Printer Friendly Page

 sweens78
- Mark as New
- Bookmark
- Subscribe
- Mute
- Subscribe to RSS Feed
- Permalink
- Report Inappropriate Content
Show Percentage on chart
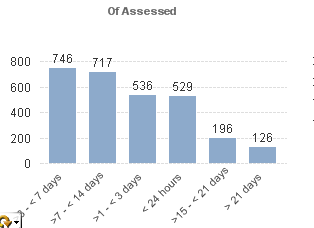
Hi Guys I have the below chart.
The user want to add up all the totals below and devide into each total on the bars so for example adding these all up
746+717+536+529+196+126 =
2850
So for example for the 746 I should get a % of 26.1%
746/2850*100=26.1% I'm trying to get a expression for the calculation!
The Dimension is Time:CMHT Appt
and Expression is Count(NEWKEYID)-Count(PatientsNotAssessed_ID)
I've tried a few just not getting right result
Any Ideas
Martin

 jonathandienst
- Mark as New
- Bookmark
- Subscribe
- Mute
- Subscribe to RSS Feed
- Permalink
- Report Inappropriate Content
You could click the 'Relative' checkbox on the Chart Properties | Expressions tab.
Or something like:
Count(NEWKEYID)-Count(PatientsNotAssessed_ID)
/
Sum(TOTAL Aggr(Count(NEWKEYID)-Count(PatientsNotAssessed_ID), Dim)
Dim is the name of the chart dimension.
