Unlock a world of possibilities! Login now and discover the exclusive benefits awaiting you.

- Qlik Community
- :
- All Forums
- :
- QlikView
- :
- Re: Stacked Chart Type
- Subscribe to RSS Feed
- Mark Topic as New
- Mark Topic as Read
- Float this Topic for Current User
- Bookmark
- Subscribe
- Mute
- Printer Friendly Page

 jduenyas
- Mark as New
- Bookmark
- Subscribe
- Mute
- Subscribe to RSS Feed
- Permalink
- Report Inappropriate Content
Stacked Chart Type
Hi all experts.
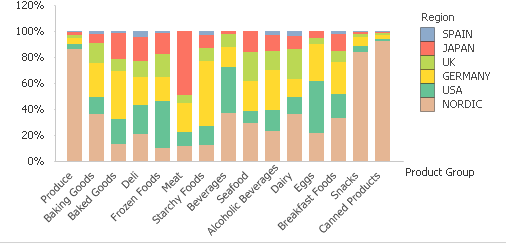
How do I create a stacked bar chart that each column fills the full height of the chart and each component in the column fills its relative height within the column?
Thanks
Accepted Solutions

 maxgro
- Mark as New
- Bookmark
- Subscribe
- Mute
- Subscribe to RSS Feed
- Permalink
- Report Inappropriate Content
the chart has 2 dims
Product Group
Region
and 1 expression (the bold part is the interesting one)
Sum({$<Year={$(=Max(Year)), $(=Max(Year)-1)}>} Sales )
/
Sum({$<Year={$(=Max(Year)), $(=Max(Year)-1)}>} TOTAL <[Product Group]> Sales )
maxgro
- Mark as New
- Bookmark
- Subscribe
- Mute
- Subscribe to RSS Feed
- Permalink
- Report Inappropriate Content
like this?
jduenyas
- Mark as New
- Bookmark
- Subscribe
- Mute
- Subscribe to RSS Feed
- Permalink
- Report Inappropriate Content
Yes!
maxgro
- Mark as New
- Bookmark
- Subscribe
- Mute
- Subscribe to RSS Feed
- Permalink
- Report Inappropriate Content
the chart has 2 dims
Product Group
Region
and 1 expression (the bold part is the interesting one)
Sum({$<Year={$(=Max(Year)), $(=Max(Year)-1)}>} Sales )
/
Sum({$<Year={$(=Max(Year)), $(=Max(Year)-1)}>} TOTAL <[Product Group]> Sales )
jduenyas
- Mark as New
- Bookmark
- Subscribe
- Mute
- Subscribe to RSS Feed
- Permalink
- Report Inappropriate Content
Mine shows like this:

jduenyas
- Mark as New
- Bookmark
- Subscribe
- Mute
- Subscribe to RSS Feed
- Permalink
- Report Inappropriate Content
Yeah. It works.
Thanks
maxgro
- Mark as New
- Bookmark
- Subscribe
- Mute
- Subscribe to RSS Feed
- Permalink
- Report Inappropriate Content
PFA
