Unlock a world of possibilities! Login now and discover the exclusive benefits awaiting you.
- Qlik Community
- :
- All Forums
- :
- QlikView
- :
- Re: Stacked bar with drill down groups
- Subscribe to RSS Feed
- Mark Topic as New
- Mark Topic as Read
- Float this Topic for Current User
- Bookmark
- Subscribe
- Mute
- Printer Friendly Page
- Mark as New
- Bookmark
- Subscribe
- Mute
- Subscribe to RSS Feed
- Permalink
- Report Inappropriate Content
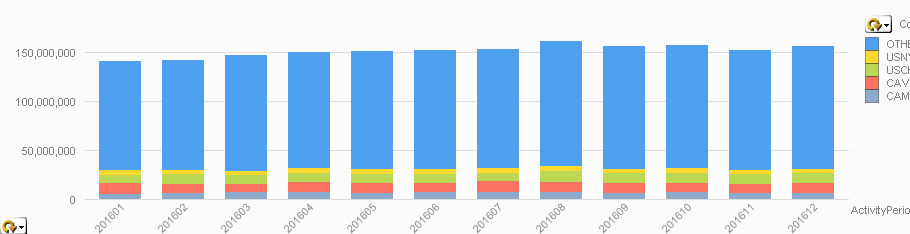
Stacked bar with drill down groups
Hi Folks,
I have bar chart with
dim1 :month
dim2 : Rgroup(drill down)
exp1: sum(sales)
when I create a stacked bar chart it is coming up correctly, but here the problem is
when I use dimensional limits for Rgroup( drill down group ) where I wanna see top 5 and remaining as "others"
it showing blank months in chart along with proper data .
for example
month I have jan,feb,mar
jan and feb is having stacked bars ,mar value is showing in the x-aixs ,but no bar for it.
I tried with "supress null values","supress zero values","supress missing values" but no luck .
but I noticed that if I go for largest 5 and not choosing option as "others" in dimensional limits tab ,it looks good.
if I check "others " option then chart is looking Odd.
pls let me know if u require any clarification about it
Accepted Solutions
- Mark as New
- Bookmark
- Subscribe
- Mute
- Subscribe to RSS Feed
- Permalink
- Report Inappropriate Content
i did for month dimension in dim limits show values greater than zero...
it worked
- Mark as New
- Bookmark
- Subscribe
- Mute
- Subscribe to RSS Feed
- Permalink
- Report Inappropriate Content
Please share sample application
- Mark as New
- Bookmark
- Subscribe
- Mute
- Subscribe to RSS Feed
- Permalink
- Report Inappropriate Content
What is not working?
Probably a versioning problem.
may look as fllws with QV 11.2 SR16:
Peter
- Mark as New
- Bookmark
- Subscribe
- Mute
- Subscribe to RSS Feed
- Permalink
- Report Inappropriate Content
We started this project in v12 only
- Mark as New
- Bookmark
- Subscribe
- Mute
- Subscribe to RSS Feed
- Permalink
- Report Inappropriate Content
it is working for pie chart
- Mark as New
- Bookmark
- Subscribe
- Mute
- Subscribe to RSS Feed
- Permalink
- Report Inappropriate Content
i did for month dimension in dim limits show values greater than zero...
it worked