Unlock a world of possibilities! Login now and discover the exclusive benefits awaiting you.

- Qlik Community
- :
- All Forums
- :
- QlikView
- :
- Stacked chart- data point
Options
- Subscribe to RSS Feed
- Mark Topic as New
- Mark Topic as Read
- Float this Topic for Current User
- Bookmark
- Subscribe
- Mute
- Printer Friendly Page
Turn on suggestions
Auto-suggest helps you quickly narrow down your search results by suggesting possible matches as you type.
Showing results for

Anonymous
Not applicable
2014-06-13
06:01 AM
- Mark as New
- Bookmark
- Subscribe
- Mute
- Subscribe to RSS Feed
- Permalink
- Report Inappropriate Content
Stacked chart- data point
Hi All,
I have to give expression on the basis of values plotted on stacked chat like:
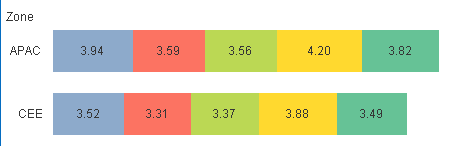
I have to define category on the basis on values displaying
like values less then 3.5 should appear as"E"
<3.75 should be as "P"...and so on.
P.S: "P" and "E" should replace their respective figure on stacked chart itself.
Thanks
Manish Madan
474 Views
1 Reply
Anonymous
Not applicable
2014-06-13
06:03 AM
Author
- Mark as New
- Bookmark
- Subscribe
- Mute
- Subscribe to RSS Feed
- Permalink
- Report Inappropriate Content
please find attached qvw file
424 Views