Unlock a world of possibilities! Login now and discover the exclusive benefits awaiting you.

- Qlik Community
- :
- All Forums
- :
- QlikView
- :
- Re: Standard Deviation on Line chart
Options
- Subscribe to RSS Feed
- Mark Topic as New
- Mark Topic as Read
- Float this Topic for Current User
- Bookmark
- Subscribe
- Mute
- Printer Friendly Page
Turn on suggestions
Auto-suggest helps you quickly narrow down your search results by suggesting possible matches as you type.
Showing results for

 tapassingh
Contributor
2019-05-14
09:23 AM
- Mark as New
- Bookmark
- Subscribe
- Mute
- Subscribe to RSS Feed
- Permalink
- Report Inappropriate Content
Standard Deviation on Line chart
I am building line chart which shows trend of users across a period (Week, 1 Month,3 Month, 6 Month, Year). I want to plot/highlight Standard deviation on that chart and mark lines with circles when it goes above or below the deviation. Like nelsons rule.
- Tags:
- standard deviation
1,854 Views
2 Replies
 chrismarlow
Specialist II
2019-05-14
03:03 PM
- Mark as New
- Bookmark
- Subscribe
- Mute
- Subscribe to RSS Feed
- Permalink
- Report Inappropriate Content
Hi,
You can use Total with Avg and StDev to lines for the bounds & then use a formula to return nulls when you are not below/above to get something like the below;
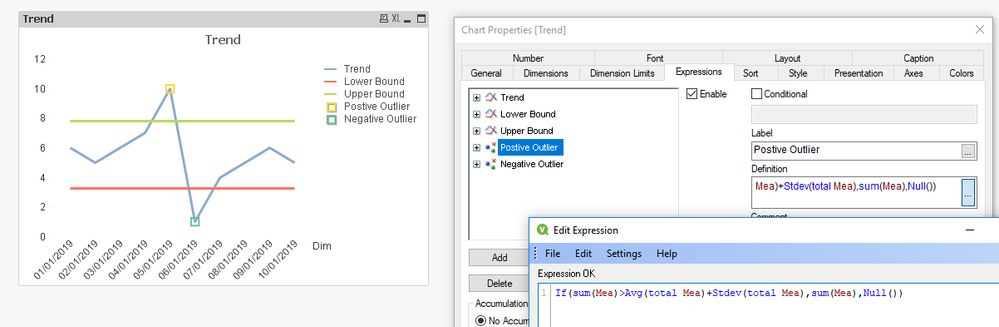
I've attached QVW, but I am on personal edition so you may not be able to open.
Cheers,
Chris.
1,843 Views
tapassingh
Contributor
2019-05-16
01:08 AM
Author
- Mark as New
- Bookmark
- Subscribe
- Mute
- Subscribe to RSS Feed
- Permalink
- Report Inappropriate Content
Thanks Chris, this helped a lot.
