Unlock a world of possibilities! Login now and discover the exclusive benefits awaiting you.
Announcements
ALERT: QlikView server communication interruptions following Microsoft Windows Domain Controller security updates
- Qlik Community
- :
- All Forums
- :
- QlikView
- :
- Re: Standarnd deviation line in line chart
Options
- Subscribe to RSS Feed
- Mark Topic as New
- Mark Topic as Read
- Float this Topic for Current User
- Bookmark
- Subscribe
- Mute
- Printer Friendly Page
Turn on suggestions
Auto-suggest helps you quickly narrow down your search results by suggesting possible matches as you type.
Showing results for
Specialist
2015-03-03
04:25 AM
- Mark as New
- Bookmark
- Subscribe
- Mute
- Subscribe to RSS Feed
- Permalink
- Report Inappropriate Content
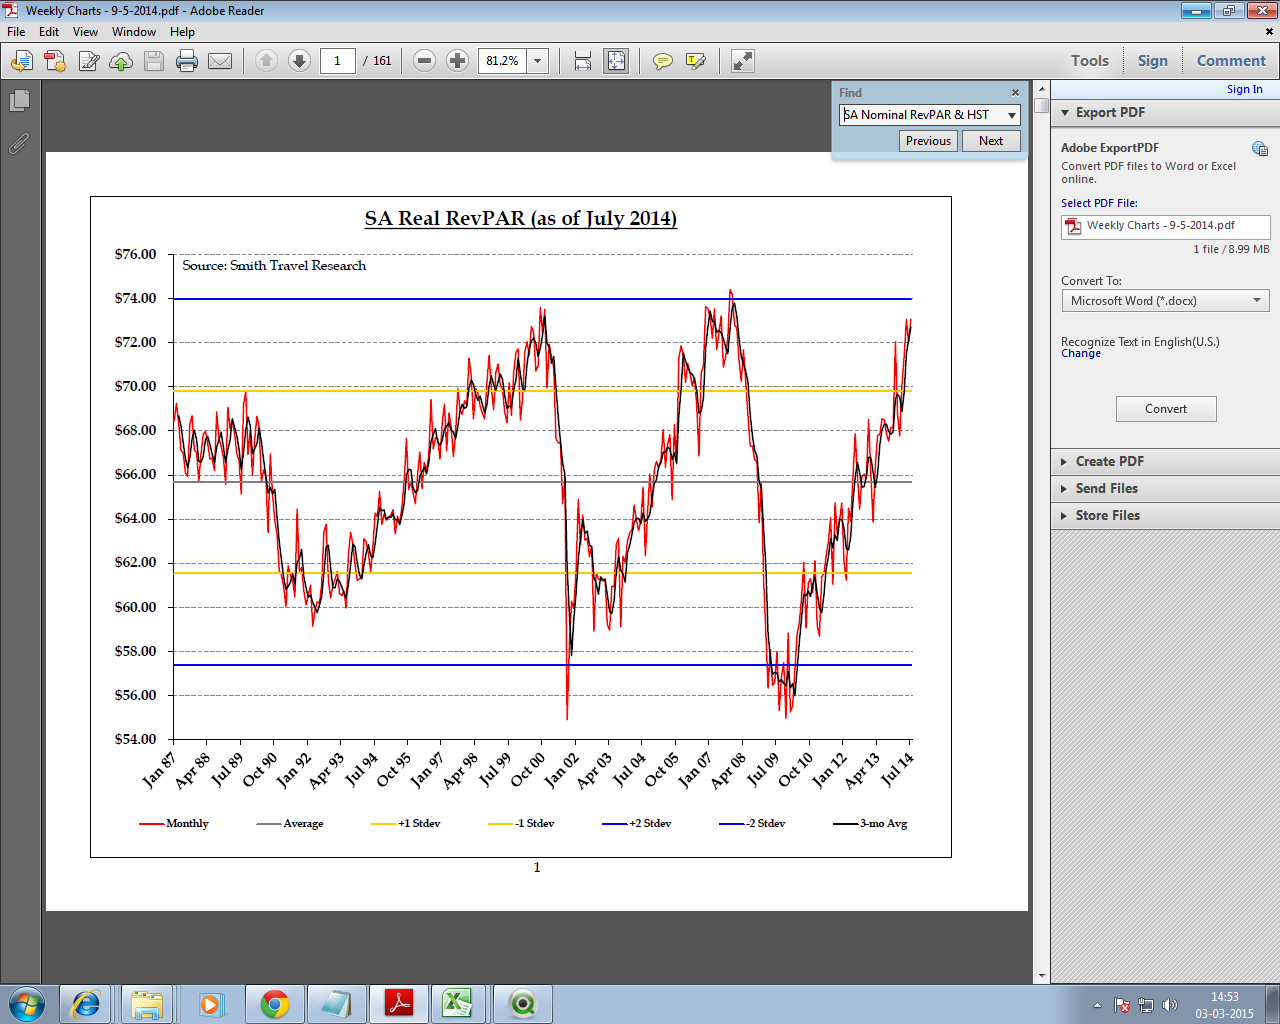
Standarnd deviation line in line chart
Hi All,
Please find below image.
Can you please suggest how to plot standard deviation line in attached QVW file.
I am not able to understand.
Thanks
638 Views
1 Solution
Accepted Solutions
Partner - Champion III
2015-03-03
04:29 AM
- Mark as New
- Bookmark
- Subscribe
- Mute
- Subscribe to RSS Feed
- Permalink
- Report Inappropriate Content
You can find an example here: QlikView Control (SPC) Chart
talk is cheap, supply exceeds demand
448 Views
1 Reply
Partner - Champion III
2015-03-03
04:29 AM
- Mark as New
- Bookmark
- Subscribe
- Mute
- Subscribe to RSS Feed
- Permalink
- Report Inappropriate Content
You can find an example here: QlikView Control (SPC) Chart
talk is cheap, supply exceeds demand
449 Views