Unlock a world of possibilities! Login now and discover the exclusive benefits awaiting you.
- Qlik Community
- :
- All Forums
- :
- QlikView
- :
- Re: Taking count in hourly basis
- Subscribe to RSS Feed
- Mark Topic as New
- Mark Topic as Read
- Float this Topic for Current User
- Bookmark
- Subscribe
- Mute
- Printer Friendly Page
- Mark as New
- Bookmark
- Subscribe
- Mute
- Subscribe to RSS Feed
- Permalink
- Report Inappropriate Content
Taking count in hourly basis
HI
i need to generate a table as i have shown in the image i need to break down the hours of the day from 00.00 hr - 24.00 how can i do this.. help in this would be really appreciated..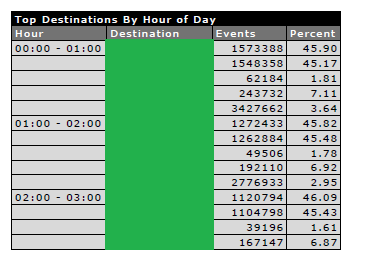
i need to show the particular counts according to each hour plz some one help me out in this .
thank you in advance 
Accepted Solutions
- Mark as New
- Bookmark
- Subscribe
- Mute
- Subscribe to RSS Feed
- Permalink
- Report Inappropriate Content
Something like =time(class(aggr(frac(YourTimeField),YourTimeField),1/24)) as your dimension should give you those hourly buckets I believe.
- Mark as New
- Bookmark
- Subscribe
- Mute
- Subscribe to RSS Feed
- Permalink
- Report Inappropriate Content
Is there anyway you could share your qvw? It is difficult to help without understanding your underlying data and how you are implementing this in your solution.
- Mark as New
- Bookmark
- Subscribe
- Mute
- Subscribe to RSS Feed
- Permalink
- Report Inappropriate Content
Something like =time(class(aggr(frac(YourTimeField),YourTimeField),1/24)) as your dimension should give you those hourly buckets I believe.
- Mark as New
- Bookmark
- Subscribe
- Mute
- Subscribe to RSS Feed
- Permalink
- Report Inappropriate Content
If you create a field from the original datetime using the hour function, as in
Hour(DateTime) as Hour
this field will have a number from 0 to 23.
Create an inline table as in
HourTable:
Load Hour,
Hour&':00 - ' & Hour+1 & ':00' as HourInterval
inline [
Hour
0
1
2
3
4
5
6
7
8
9
10
11
12
13
14
15
16
17
18
19
20
21
22
23
];
Now you have the data associated with the Hour Interval you need.
Eduardo
- Mark as New
- Bookmark
- Subscribe
- Mute
- Subscribe to RSS Feed
- Permalink
- Report Inappropriate Content
Christian this actually worked but isn't there any of displayin the hours as 00.00- 01.00 , 01.00-02.00 etc ?? as its shown in the above table ??