Unlock a world of possibilities! Login now and discover the exclusive benefits awaiting you.

Announcements
Q&A with Qlik - Qlik Cloud Migration: Questions about migrating to Qlik Cloud? Catch the latest replay!
- Qlik Community
- :
- All Forums
- :
- QlikView
- :
- Re: Total avg in linechart
Options
- Subscribe to RSS Feed
- Mark Topic as New
- Mark Topic as Read
- Float this Topic for Current User
- Bookmark
- Subscribe
- Mute
- Printer Friendly Page
Turn on suggestions
Auto-suggest helps you quickly narrow down your search results by suggesting possible matches as you type.
Showing results for

 francisvandergr
Partner - Creator II
2016-02-29
11:08 AM
- Mark as New
- Bookmark
- Subscribe
- Mute
- Subscribe to RSS Feed
- Permalink
- Report Inappropriate Content
Total avg in linechart
I like to have an avg of Total(Sales) / quantity till the periode in my chart
Accumalate is not the solution
I include an example
Has someone a solution ?
- Tags:
- new_to_qlikview
598 Views
1 Solution
Accepted Solutions

 settu_periasamy
Master III
2016-02-29
11:23 AM
- Mark as New
- Bookmark
- Subscribe
- Mute
- Subscribe to RSS Feed
- Permalink
- Report Inappropriate Content
May be like this..
=Rangesum(above(total Sum(Sales),0,Period))/
Rangesum(above(total Sum(Quantity),0,Period))
539 Views
3 Replies

Anonymous
Not applicable
2016-02-29
11:11 AM
- Mark as New
- Bookmark
- Subscribe
- Mute
- Subscribe to RSS Feed
- Permalink
- Report Inappropriate Content
add new Expression: aggr(avg(Sales) / Quantity,Period)

 sunny_talwar
MVP
2016-02-29
11:14 AM
- Mark as New
- Bookmark
- Subscribe
- Mute
- Subscribe to RSS Feed
- Permalink
- Report Inappropriate Content
Try this:
RangeSum(Above(Sum(Sales), 0, RowNo()))/RangeSum(Above(Sum(Quantity), 0, RowNo()))
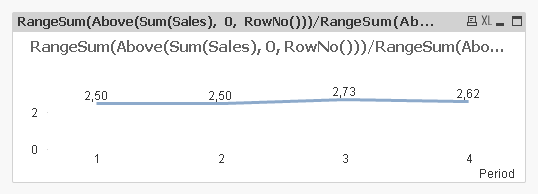
UPDATE: Make sure you set Accumulation back to No Accumulation
settu_periasamy
Master III
2016-02-29
11:23 AM
- Mark as New
- Bookmark
- Subscribe
- Mute
- Subscribe to RSS Feed
- Permalink
- Report Inappropriate Content
May be like this..
=Rangesum(above(total Sum(Sales),0,Period))/
Rangesum(above(total Sum(Quantity),0,Period))
540 Views