Unlock a world of possibilities! Login now and discover the exclusive benefits awaiting you.

- Qlik Community
- :
- All Forums
- :
- QlikView
- :
- Trendline Week
- Subscribe to RSS Feed
- Mark Topic as New
- Mark Topic as Read
- Float this Topic for Current User
- Bookmark
- Subscribe
- Mute
- Printer Friendly Page

 kris_vliegen
- Mark as New
- Bookmark
- Subscribe
- Mute
- Subscribe to RSS Feed
- Permalink
- Report Inappropriate Content
Trendline Week
Hi All,
I would like to make charge with a trendLine.
We have a dashboard with volumes petrol from fuelstations by day.
Because the volume in a weekend is less then a weekdayvolume. We would like to see a volume by day. But the volume in the graph would be the volume + the volume of the previous 6 days (so we have one week). Can I do this in the chart?
Or do I have to do this in the script?
The volume for the 10th of setptember in the graph should be the volume from 4 + 5 + 6 + 7+ 8 + 9 +10th of september.
Regards,
Kris
- Tags:
- bar graph
- trend line
Accepted Solutions
kris_vliegen
- Mark as New
- Bookmark
- Subscribe
- Mute
- Subscribe to RSS Feed
- Permalink
- Report Inappropriate Content
Hi All,
thaks for both the responses.
I've created the trendvolume in the script.
Like this
Load KeyTrend, // where KeyTrend = Site_Id & Article
DatumNum,
Volume ,
If(KeyTrend = Peek(KeyTrend), Peek(Volume) + Volume, Volume) as Volume2,
If(KeyTrend = Peek(KeyTrend), Peek(Volume2) + Volume, Volume) as Volume3,
If(KeyTrend = Peek(KeyTrend), Peek(Volume3) + Volume, Volume) as Volume4,
If(KeyTrend = Peek(KeyTrend), Peek(Volume4) + Volume, Volume) as Volume5,
If(KeyTrend = Peek(KeyTrend), Peek(Volume5) + Volume, Volume) as Volume6,
If(KeyTrend = Peek(KeyTrend), Peek(Volume6) + Volume, Volume) as TrendVolume
resident TrendTemp1 order by KeyTrend, DatumNum;
Regards,
Kris

 sunny_talwar
- Mark as New
- Bookmark
- Subscribe
- Mute
- Subscribe to RSS Feed
- Permalink
- Report Inappropriate Content
May be something like this
RangeSum(Above(Sum(Volume), 0, 6))
 johanlindell
- Mark as New
- Bookmark
- Subscribe
- Mute
- Subscribe to RSS Feed
- Permalink
- Report Inappropriate Content
One solution is to make a special "rolling" 7 days dimension pointing to you calendar. In this "rolling 7 days"-table you will for each "rolling 7 date" have 7 rows of each "rolling 7 date" pointing to this date, the day before etc until 6 days before. Then you just switch your chart to having this new field as dimension:
Date, Rolling 7 date
2016-10-13, 2016-10-13
2016-10-12, 2016-10-13
2016-10-11, 2016-10-13
2016-10-10, 2016-10-13
2016-10-09, 2016-10-13
2016-10-08, 2016-10-13
2016-10-07, 2016-10-13
2016-10-12, 2016-10-12
2016-10-11, 2016-10-12
2016-10-10, 2016-10-12
2016-10-09, 2016-10-12
2016-10-08, 2016-10-12
2016-10-07, 2016-10-12
2016-10-06, 2016-10-12
//Johan
kris_vliegen
- Mark as New
- Bookmark
- Subscribe
- Mute
- Subscribe to RSS Feed
- Permalink
- Report Inappropriate Content
Hi All,
thaks for both the responses.
I've created the trendvolume in the script.
Like this
Load KeyTrend, // where KeyTrend = Site_Id & Article
DatumNum,
Volume ,
If(KeyTrend = Peek(KeyTrend), Peek(Volume) + Volume, Volume) as Volume2,
If(KeyTrend = Peek(KeyTrend), Peek(Volume2) + Volume, Volume) as Volume3,
If(KeyTrend = Peek(KeyTrend), Peek(Volume3) + Volume, Volume) as Volume4,
If(KeyTrend = Peek(KeyTrend), Peek(Volume4) + Volume, Volume) as Volume5,
If(KeyTrend = Peek(KeyTrend), Peek(Volume5) + Volume, Volume) as Volume6,
If(KeyTrend = Peek(KeyTrend), Peek(Volume6) + Volume, Volume) as TrendVolume
resident TrendTemp1 order by KeyTrend, DatumNum;
Regards,
Kris
kris_vliegen
- Mark as New
- Bookmark
- Subscribe
- Mute
- Subscribe to RSS Feed
- Permalink
- Report Inappropriate Content
Hi Sunny,
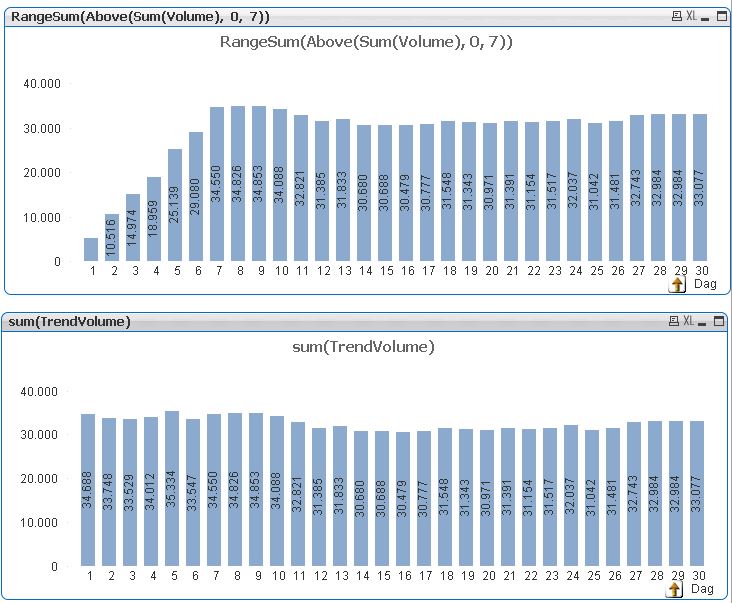
this works but the first 6 days of a month it doesn't show the correct values.
sunny_talwar
- Mark as New
- Bookmark
- Subscribe
- Mute
- Subscribe to RSS Feed
- Permalink
- Report Inappropriate Content
Try this:
RangeSum(Above(Sum({1}Volume), 0, 6)) * Avg(1)
sunny_talwar
- Mark as New
- Bookmark
- Subscribe
- Mute
- Subscribe to RSS Feed
- Permalink
- Report Inappropriate Content
Actually, instead of using 1, you would need to ignore date related field because one will ignore all selections, but I am not sure what all date fields you have where you plan to make selections, but those are the ones I would ignore. You will still see the selected area in your chart because of the use of Avg(1) which will be 0 outside of the selection. RangeSum() will take place over all the data included the unselected dates.
kris_vliegen
- Mark as New
- Bookmark
- Subscribe
- Mute
- Subscribe to RSS Feed
- Permalink
- Report Inappropriate Content
If I ignore the date related field. QV count all the first days of each month, all the second days, ...
So the result is not what I expected.
I have now calculated the trend in the script and this is working fine for me.
Regards,
Kris
sunny_talwar
- Mark as New
- Bookmark
- Subscribe
- Mute
- Subscribe to RSS Feed
- Permalink
- Report Inappropriate Content
I don't really know your setup, but if you want to take this route you can provide a sample to work with and I can look into it 
 MarcoWedel
- Mark as New
- Bookmark
- Subscribe
- Mute
- Subscribe to RSS Feed
- Permalink
- Report Inappropriate Content
Hi,
there might as well be an easier solution to your question using the chart integrated accumulation function:
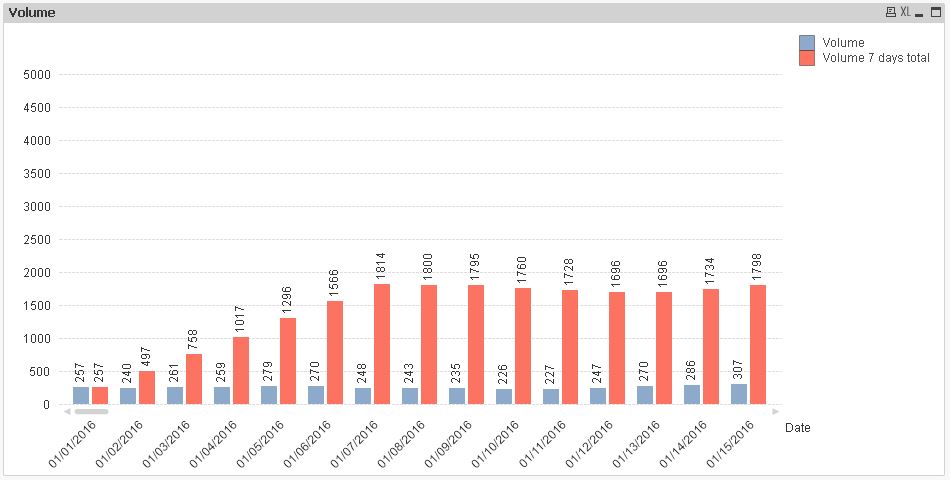
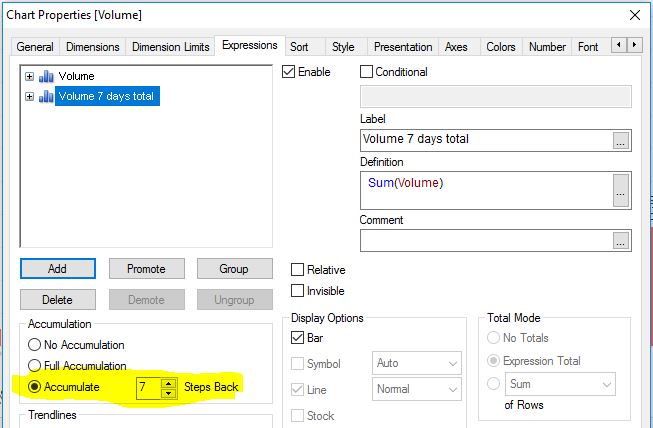
hope this helps
regards
Marco
