Unlock a world of possibilities! Login now and discover the exclusive benefits awaiting you.
- Qlik Community
- :
- All Forums
- :
- QlikView
- :
- Re: Two Tables with Current Selection with only on...
- Subscribe to RSS Feed
- Mark Topic as New
- Mark Topic as Read
- Float this Topic for Current User
- Bookmark
- Subscribe
- Mute
- Printer Friendly Page
- Mark as New
- Bookmark
- Subscribe
- Mute
- Subscribe to RSS Feed
- Permalink
- Report Inappropriate Content
Two Tables with Current Selection with only one selection different
Hi
I need two tables to show data from current selection and the same table. The first table has to show the values from the "Real" income and the second one from the budget income.
I need to show the data "As Is", i.e. not the sum or something like.
| RealBudget | Amount | Date | Center |
| Real | 5000 | 01-02-2016 | 123 |
| Real | 500 | 02-02-2016 | 125 |
| Real | 300 | 03-02-2016 | 123 |
| Real | 200 | 04-02-2016 | 126 |
| Budget | 6000 | 01-02-2016 | 123 |
| Budget | 600 | 02-02-2016 | 125 |
| Budget | 350 | 03-02-2016 | 123 |
| Budget | 250 | 04-02-2016 | 126 |
Any idea how to do this? I actually can show the info but in the same table.. but how can I split the data in two tables Real/Budget?
Thanks!!
Accepted Solutions
- Mark as New
- Bookmark
- Subscribe
- Mute
- Subscribe to RSS Feed
- Permalink
- Report Inappropriate Content
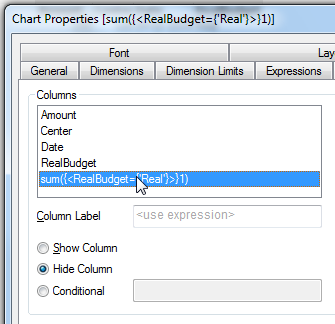
You may do something like this in straight table
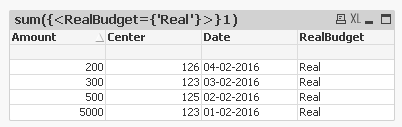
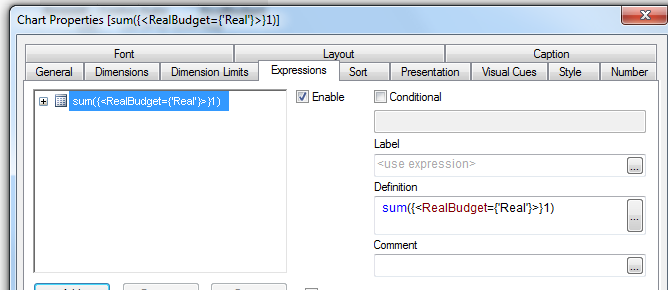
and hide the expression
- Mark as New
- Bookmark
- Subscribe
- Mute
- Subscribe to RSS Feed
- Permalink
- Report Inappropriate Content
May be using set analysis within a straight table? Which object are you trying to this today?
- Mark as New
- Bookmark
- Subscribe
- Mute
- Subscribe to RSS Feed
- Permalink
- Report Inappropriate Content
You may do something like this in straight table
and hide the expression
- Mark as New
- Bookmark
- Subscribe
- Mute
- Subscribe to RSS Feed
- Permalink
- Report Inappropriate Content
It worked! Thanks!
- Mark as New
- Bookmark
- Subscribe
- Mute
- Subscribe to RSS Feed
- Permalink
- Report Inappropriate Content
Hello,
Please find attached a way to solve the problem.
You just have to create 2 graph "Table".
Put Realbudget, Date and Center as Dimension and in the expression you have to use a "if".
-> For real : if(RealBudget = 'Real',sum(Amount))
-> For budget : if(RealBudget = 'Budget',sum(Amount))
Regards
Sara