Unlock a world of possibilities! Login now and discover the exclusive benefits awaiting you.
Announcements
ALERT: QlikView server communication interruptions following Microsoft Windows Domain Controller security updates
- Qlik Community
- :
- All Forums
- :
- QlikView
- :
- Re: Using DISTINCT and SUM together
Options
- Subscribe to RSS Feed
- Mark Topic as New
- Mark Topic as Read
- Float this Topic for Current User
- Bookmark
- Subscribe
- Mute
- Printer Friendly Page
Turn on suggestions
Auto-suggest helps you quickly narrow down your search results by suggesting possible matches as you type.
Showing results for
Not applicable
2016-08-06
04:53 AM
- Mark as New
- Bookmark
- Subscribe
- Mute
- Subscribe to RSS Feed
- Permalink
- Report Inappropriate Content
Using DISTINCT and SUM together
Hi All,
I am a newbie here. I am facing issue, please suggest.
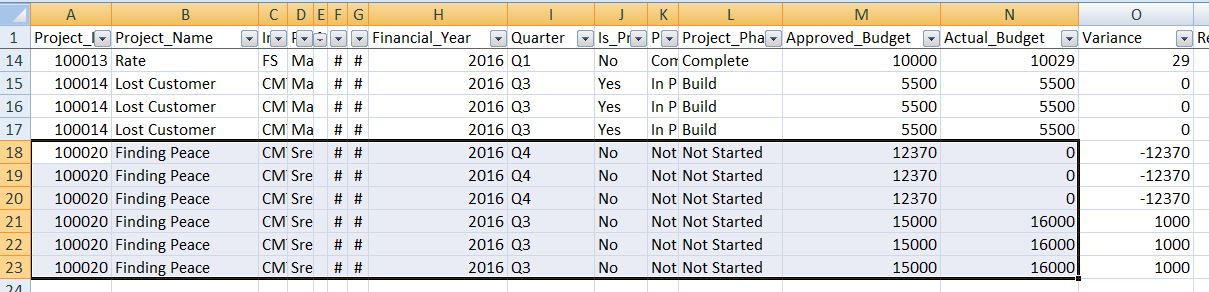
I have data like below, the data is not normalized so need to write some expressions.
I have Project data, quarter wise. As below figure states, I have repeated data for the same quarter.
I am trying to put expression is the chart, where the Approved budget will be the sum of the column where the quarters are distinct.
Please help as I am really struggling with the syntax.
1,821 Views
- « Previous Replies
-
- 1
- 2
- Next Replies »
10 Replies
Champion III
2016-08-07
05:05 AM
- Mark as New
- Bookmark
- Subscribe
- Mute
- Subscribe to RSS Feed
- Permalink
- Report Inappropriate Content
Try with a bar chart, a chart with dimension Year-Month and two expressions for Approved / Exenditure should show the data quite well.
Or what is the way you expect the data to look?
175 Views
- « Previous Replies
-
- 1
- 2
- Next Replies »