Unlock a world of possibilities! Login now and discover the exclusive benefits awaiting you.
- Qlik Community
- :
- All Forums
- :
- QlikView
- :
- Re: Value M vs Value M-1 in a table chart
- Subscribe to RSS Feed
- Mark Topic as New
- Mark Topic as Read
- Float this Topic for Current User
- Bookmark
- Subscribe
- Mute
- Printer Friendly Page
- Mark as New
- Bookmark
- Subscribe
- Mute
- Subscribe to RSS Feed
- Permalink
- Report Inappropriate Content
Value M vs Value M-1 in a table chart
Dear all,
I need to show in a table chart :
- inventory value of the current month in selection
- inventory value of the previous month
- Difference between M and M-1 inventory value
Thanks to some nice help, i have been able to show in a text object the inventory value of the provious month but as i am now trying to paste the formulas in a table chart, the value is shown but linked to the previous month...
let me show you :
For instance :
In october 2016 :
Inventory value is 1254
Inventory value of the previous month is 408 (september figure then)
Difference between M & M-1 is 846
Below is print screen of what i get : the text object is right but the data in the table chart is wrong
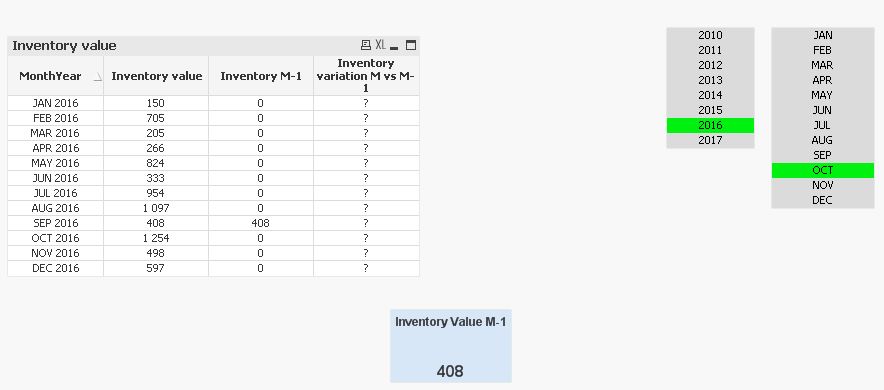
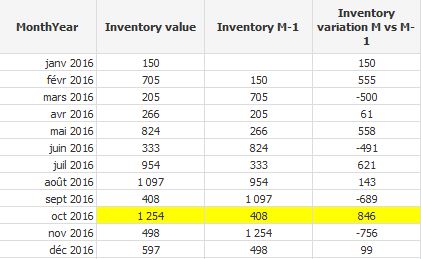
And this is what i am looking for :
Attached is .qvw and excel database for those who want to help
Thanks in advance
Guillaume
- « Previous Replies
- Next Replies »
- Mark as New
- Bookmark
- Subscribe
- Mute
- Subscribe to RSS Feed
- Permalink
- Report Inappropriate Content
May be change it to this
If(Len(Trim([Inventory value])) > 0, [Inventory value] - Sum(TOTAL{$<MonthYear = {"$(=Date(AddMonths(YearStart(Max(MonthYear)), -1), 'MMM YYYY'))"}, Mois, Année>}[Inventory Value]))
- Mark as New
- Bookmark
- Subscribe
- Mute
- Subscribe to RSS Feed
- Permalink
- Report Inappropriate Content
Does not seem to work :
- Mark as New
- Bookmark
- Subscribe
- Mute
- Subscribe to RSS Feed
- Permalink
- Report Inappropriate Content
Use this
[Inventory value] - Sum(TOTAL {$<MonthYear = {"$(=Date(AddMonths(YearStart(Max(MonthYear)), -1), 'MMM YYYY'))"}, Mois, Année>}[Inventory Value]) * Avg({$<MonthYear = {"$(='>=' & Date(YearStart(Max(MonthYear)), 'MMM YYYY') & '<=' & Date(Max(MonthYear), 'MMM YYYY'))"}, Mois, Année>} 1)
- Mark as New
- Bookmark
- Subscribe
- Mute
- Subscribe to RSS Feed
- Permalink
- Report Inappropriate Content
Wonderful.
Thanks Sunny
- Mark as New
- Bookmark
- Subscribe
- Mute
- Subscribe to RSS Feed
- Permalink
- Report Inappropriate Content
Great.... Since this thread has grown in responses, I would suggest you take some time to mark some helpful responses. The reason I ask this is because when other land on this thread, they might find themselves lost looking for answers, but marking some of the responses as helpful, you might be able to steer them to useful responses. You can mark as many helpful responses as you want, but make sure not to overdo... because overdoing defeats the purpose of marking anything helpful.
Qlik Community Tip: Marking Replies as Correct or Helpful
Best,
Sunny
- Mark as New
- Bookmark
- Subscribe
- Mute
- Subscribe to RSS Feed
- Permalink
- Report Inappropriate Content
Ok Sunny i will
- Mark as New
- Bookmark
- Subscribe
- Mute
- Subscribe to RSS Feed
- Permalink
- Report Inappropriate Content
Thank you 
- « Previous Replies
- Next Replies »