Unlock a world of possibilities! Login now and discover the exclusive benefits awaiting you.
- Qlik Community
- :
- All Forums
- :
- QlikView
- :
- Re: Visualization of Graph Data
- Subscribe to RSS Feed
- Mark Topic as New
- Mark Topic as Read
- Float this Topic for Current User
- Bookmark
- Subscribe
- Mute
- Printer Friendly Page
- Mark as New
- Bookmark
- Subscribe
- Mute
- Subscribe to RSS Feed
- Permalink
- Report Inappropriate Content
Visualization of Graph Data
Hi all,
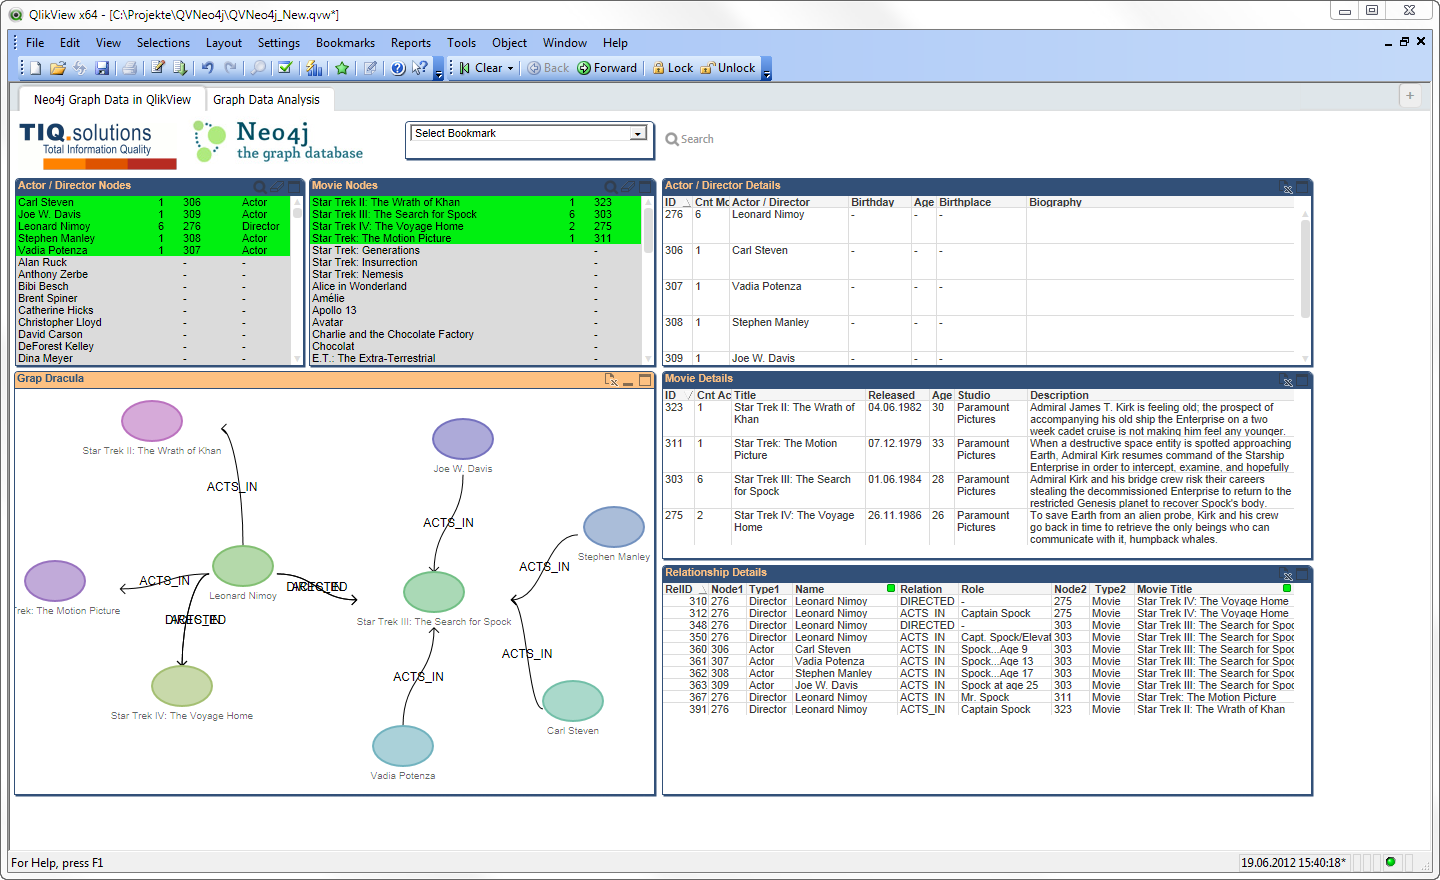
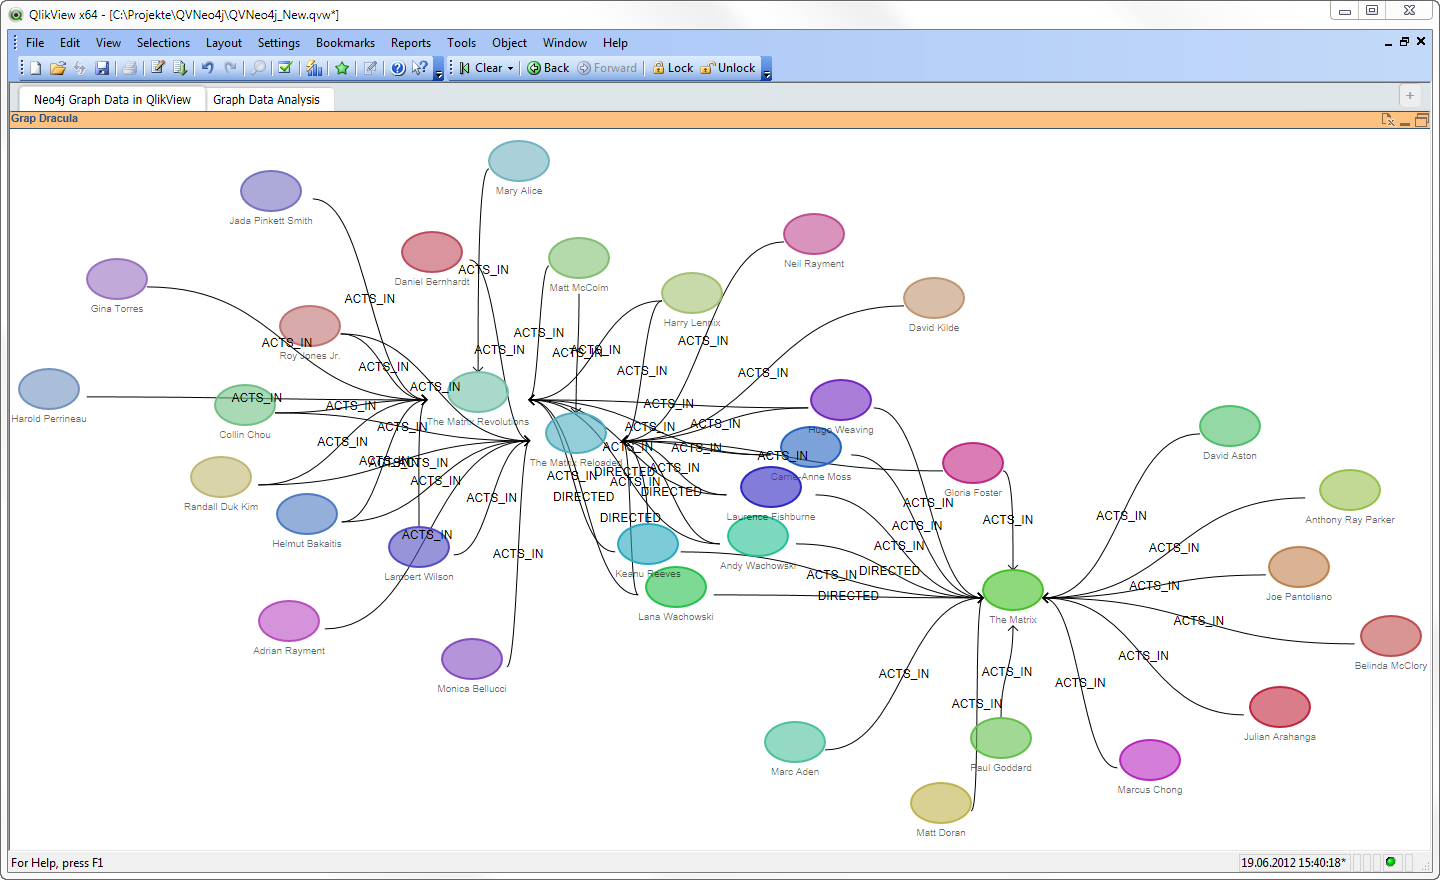
I started to develop an extension for graph visualization based on the Graph Dracula Library, using Raphael: http://www.graphdracula.net
This seems to be an interesting topic. First of all, what is the best data representation of graph data in a relational QlikView world? Second, there are a lot of limitations using those JavaScript libs. I've tried some before (D3.js etc.) but Dracula seems to have the simplest interface for my use case.
What is your opinion?
- Ralf
- Mark as New
- Bookmark
- Subscribe
- Mute
- Subscribe to RSS Feed
- Permalink
- Report Inappropriate Content
Hi,
Is there any way that the chart remains in a same position? Actually I see that whenever I refresh the Dashboard, the position of the bubbles change
- Mark as New
- Bookmark
- Subscribe
- Mute
- Subscribe to RSS Feed
- Permalink
- Report Inappropriate Content
No.
- Mark as New
- Bookmark
- Subscribe
- Mute
- Subscribe to RSS Feed
- Permalink
- Report Inappropriate Content
Hi
Do we have anything similar for Qlik Sense?
Thanks for your help..
- Mark as New
- Bookmark
- Subscribe
- Mute
- Subscribe to RSS Feed
- Permalink
- Report Inappropriate Content
Yes, we (TIQ Solutions) provide commercial graph extensions.
- Mark as New
- Bookmark
- Subscribe
- Mute
- Subscribe to RSS Feed
- Permalink
- Report Inappropriate Content
Hello,
I am very interested in graph visualization and I have worked only at the level of a graph-database for the moment: neo4j. I had not heard before of graph-dracula.
So a big point in your work is that you are using a relational database as a basis? Are you also contemplating using a graph-database such as neo4j as data input, or perhaps the qlik products are incompatible?
Best regards!
- Mark as New
- Bookmark
- Subscribe
- Mute
- Subscribe to RSS Feed
- Permalink
- Report Inappropriate Content
Hi Juan,
yes, you can use Neo4j as a data source with our JDBC Connector to run Cypher queries. There are also a couple of graph analytics and data blending extensions from us for Qlik Sense.
Fo visualizaiont we've integrated Linkurious Ogma.js (https://doc.linkurio.us/ogma/latest/) and Vis.js (Network Examples).
Data blending works via Ajax, means you can run a Cypher query on user interaction and visualize results or process selections from the results.
We also work on a server-side extension (SSE) integration with Neo4j using gRPC protocol.
Best regards,
Ralf
- Mark as New
- Bookmark
- Subscribe
- Mute
- Subscribe to RSS Feed
- Permalink
- Report Inappropriate Content
Dear Ralf,
Thanks for share/create the extension.
It saved our lives to create a visualization for evolutions of aircraft materials and easily find out complex evolutions.
OEM Solution Architect
LATAM
- Mark as New
- Bookmark
- Subscribe
- Mute
- Subscribe to RSS Feed
- Permalink
- Report Inappropriate Content
Thanks, Ricardo. Would be great if you could share some screenshots to illustrade your use case!
- Mark as New
- Bookmark
- Subscribe
- Mute
- Subscribe to RSS Feed
- Permalink
- Report Inappropriate Content
Hello, I'm very sorry/
I'm new in qlick and would be very appreciative if you recommend me how import Extensions to Qlik Sense Desktop if it is possible.
I try found it out in guides, but without success.
I want try to use extensionы described above, but don't understand how...

- Mark as New
- Bookmark
- Subscribe
- Mute
- Subscribe to RSS Feed
- Permalink
- Report Inappropriate Content
Extensions mentioned here are for QlikView, not Qlik Sense..