Unlock a world of possibilities! Login now and discover the exclusive benefits awaiting you.

- Qlik Community
- :
- All Forums
- :
- QlikView
- :
- Visualizing SUMs calculated by Set Analysis
- Subscribe to RSS Feed
- Mark Topic as New
- Mark Topic as Read
- Float this Topic for Current User
- Bookmark
- Subscribe
- Mute
- Printer Friendly Page

- Mark as New
- Bookmark
- Subscribe
- Mute
- Subscribe to RSS Feed
- Permalink
- Report Inappropriate Content
Visualizing SUMs calculated by Set Analysis
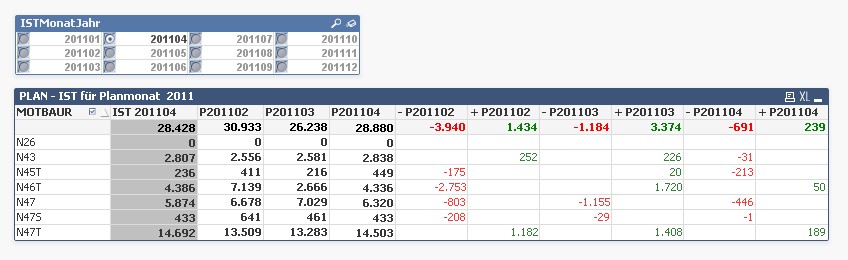
Dear all,
I need to visualize the negative and positive differences between the first column and columns 2,3,4. I managed to extract the positive and negative differences with "if(Column(1)<Column(2),Column(1) - Column(2))" as you can see in the screenshot above.
I now would like to visualize the sums of differences (+/-) over the the dimension P201102, P201103, P201104 ignoring the Dimension MOTBAUR. Unfortunately these columns are calulated via set Analysis so i don't have a dimension i can use in the graph.
What would be the way to achieve this?
Thank you.
BR
Andreas
- Mark as New
- Bookmark
- Subscribe
- Mute
- Subscribe to RSS Feed
- Permalink
- Report Inappropriate Content
Hi Andreas,
There are multiple options, but would a total row at the bottom not give you the expected answer?
Otherwise the following two options would work I guess:
- create a set analysis for the new expression which ignores MOTBAUR (e.g. using MOTBOUR = in the set analysis)
- create a extra object without the MOTBAUR dimension
Kind regards,
Matthijs