Unlock a world of possibilities! Login now and discover the exclusive benefits awaiting you.

- Qlik Community
- :
- All Forums
- :
- QlikView
- :
- Re: Waterfall chart
- Subscribe to RSS Feed
- Mark Topic as New
- Mark Topic as Read
- Float this Topic for Current User
- Bookmark
- Subscribe
- Mute
- Printer Friendly Page

- Mark as New
- Bookmark
- Subscribe
- Mute
- Subscribe to RSS Feed
- Permalink
- Report Inappropriate Content
Waterfall chart
Guys,
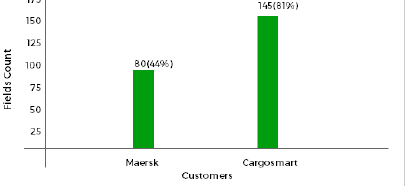
I have the below bar chart. I need to create a waterfall chart based on the highest value (sort by descending order) as shown below,
Expected Chart: (by comparing the values from the above bar chart)
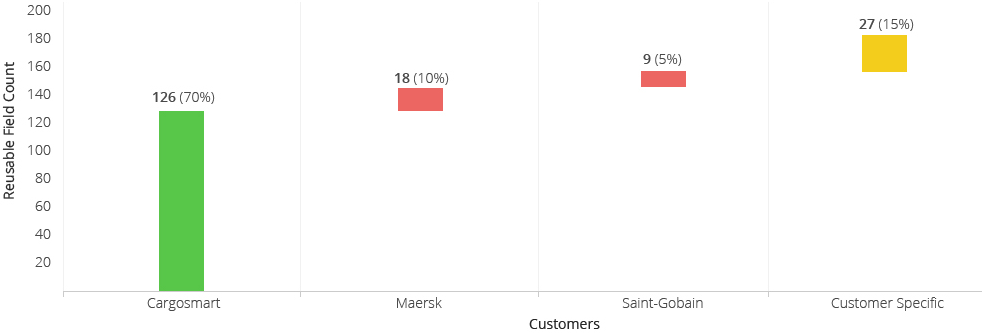
Calculation Logic:
1. As per the chart1, customer Cargosmart has the highest count(145) and Maersk has 80.
2. Both the customers have some fields in common. Field count shows the count as (126) 70% in the second chart (waterfall chart) and 18(10%) for Maersk out of the remaining 30% (because out of 80 fields in maersk 62 fields already matched in Cargosmart) and so on in descending order.
similarly for all customers until it reaches 100%.
Please help me to achieve this guys.
Note: The above mentioned two charts don't relate each other as per my logic. so please don't compare both.
Thanks,
Siva.

 sunny_talwar
- Mark as New
- Bookmark
- Subscribe
- Mute
- Subscribe to RSS Feed
- Permalink
- Report Inappropriate Content
Do you have a sample to share?
- Mark as New
- Bookmark
- Subscribe
- Mute
- Subscribe to RSS Feed
- Permalink
- Report Inappropriate Content
Attached sample data and QVW. Please check it.
sunny_talwar
- Mark as New
- Bookmark
- Subscribe
- Mute
- Subscribe to RSS Feed
- Permalink
- Report Inappropriate Content
So when Hapag Lloyd is selected, you want the second bar to start from 2 and third bar from 6?
- Mark as New
- Bookmark
- Subscribe
- Mute
- Subscribe to RSS Feed
- Permalink
- Report Inappropriate Content
I need to get the maximum value and sort it by descendig order.
When Hapag Lloyd is selected, I want the third bar (Maersk) to show first from (0 to 5) in y-axis and then Cargosmart and then Addivant, but one condition it should not show the common fields between each other.
i,e 1. Maersk - 5
2. Cargosmart - 0 (because it has all the 4 values common in Maersk) and
3. Addivant - 0 (2 fields already common to Cargosmart)
I have to compare the common fields in this hierarchy- Maerk- Cargosmart - Addivant.
- Mark as New
- Bookmark
- Subscribe
- Mute
- Subscribe to RSS Feed
- Permalink
- Report Inappropriate Content
Are you confused? Please see this attachment.
In this, for Addivant customer, the field "Goods" is only specific to it.
so, in waterfall chart, I want the count as below,
Maersk - 5 (First)
Addivant - 1 *Second) and
Cargosmart -0.
sunny_talwar
- Mark as New
- Bookmark
- Subscribe
- Mute
- Subscribe to RSS Feed
- Permalink
- Report Inappropriate Content
Checking... I sort of understand the requirement, but the calculation is a little complex
- Mark as New
- Bookmark
- Subscribe
- Mute
- Subscribe to RSS Feed
- Permalink
- Report Inappropriate Content
Sunny, got any idea on this?
- Mark as New
- Bookmark
- Subscribe
- Mute
- Subscribe to RSS Feed
- Permalink
- Report Inappropriate Content
Sunny please respond if it is possible to do?