Unlock a world of possibilities! Login now and discover the exclusive benefits awaiting you.

- Qlik Community
- :
- All Forums
- :
- QlikView
- :
- Re: YTD Calculation for Weekly Dashboard
- Subscribe to RSS Feed
- Mark Topic as New
- Mark Topic as Read
- Float this Topic for Current User
- Bookmark
- Subscribe
- Mute
- Printer Friendly Page

 ishanbansal1204
- Mark as New
- Bookmark
- Subscribe
- Mute
- Subscribe to RSS Feed
- Permalink
- Report Inappropriate Content
YTD Calculation for Weekly Dashboard
Hi Experts,
I have a situation where
Data set has been attached ***
Week and year are the filters
1st dashboard
gender is the dimension and count(age_group) is the measure
Now, when i select week and year from the filter i get details of that week.
But now as per the requirement i want the YTD values for the same
so if i am selecting week 6 and year 2016
i should get the values from week count(week1 till week6) of 2016 ( Basically the YTD)
Please suggest.
Accepted Solutions

 sunny_talwar
- Mark as New
- Bookmark
- Subscribe
- Mute
- Subscribe to RSS Feed
- Permalink
- Report Inappropriate Content
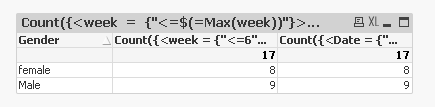
Here are two expressions you can use
1) Count({<week = {"<=$(=Max(week))"}>} age_group)
2) Count({<Date = {">=$(=YearStart(Max(Date)))<=$(=Max(Date))"}, week, year>} age_group)
sunny_talwar
- Mark as New
- Bookmark
- Subscribe
- Mute
- Subscribe to RSS Feed
- Permalink
- Report Inappropriate Content
Here are two expressions you can use
1) Count({<week = {"<=$(=Max(week))"}>} age_group)
2) Count({<Date = {">=$(=YearStart(Max(Date)))<=$(=Max(Date))"}, week, year>} age_group)
ishanbansal1204
- Mark as New
- Bookmark
- Subscribe
- Mute
- Subscribe to RSS Feed
- Permalink
- Report Inappropriate Content
Hi Sunny,
In this case this will work for Week, but we need to add year parameter as well rite?
sunny_talwar
- Mark as New
- Bookmark
- Subscribe
- Mute
- Subscribe to RSS Feed
- Permalink
- Report Inappropriate Content
1st expression will most likely need it, but the second expression should be fine.
